

Question: Please help I have no idea how to even start, so anything would help! I have to be using Windows PowerShell ISE- PLEASE PLEASE DO
Please help I have no idea how to even start, so anything would help! I have to be using Windows PowerShell ISE- PLEASE PLEASE DO NOT USE OTHERS ANSWERS Thanks -
I have made some progress but I have no idea how to format the data and get the last grade
This is the data
Jamie Zawinski,78.8,65.0,87.3,90.0,89.0,79.0 Adam Douglas,86.2,59.0,77.8,81.0,87.5,88.0 Wallace Steven,66.2,68.0,91.3,78.6,80.3,86.4 Paul Wolfowitz,98.8,95.0,89.3,93.0,88.0,90.4 Henry Williamson,88.8,91.0,87.8,92.4,79.8,89.5 Margie Rodriguez,80.5,89.0,78.3,92.0,88.0,90.0 Joseph Manuel,80.3,77.5,79.4,92.0,83.0,91.0 Seth Pereira,85.8,69.0,91.3,92.0,74.0,92.0 Berndon Markus,79.6,93.0,88.3,92.0,82.0,85.0 Camelia Peterson,29.5,38.0,48.3,62.0,42.0,35.0 Oliver Jones,67.6,45.0,39.3,66.0,70.0,67.0 Maria Federer,78.6,75.0,81.3,63.0,45.0,80.0 Robert Meder,68.6,55.6,71.8,64.6,55.3,73.1 Charles Modera,78.6,85.1,74.3,66.6,81.3,70.2 Arun Malhotra,75.1,78.3,80.5,56.8,78.3,74.5 Joel Perez,89.1,80.3,83.5,86.9,88.3,84.5 Soles Azuri,93.2,91.0,89.0,96.3,88.0,98.4 Dennis Hutchingson,58.0,45.0,34.0,40.0,40.0,48.0 Susan Johnson,78.9,69.6,89.0,84.2,72.1,80.2 Raj Prakash,78.5,89.2,90.1,67.0,78.5,80.5 Charles Bowen,76.3,56.8,90.2,87.4,80.6,76.8 Jack Woods,78.3,77.5,98.0,89.0,69.0,87.0 Binal Patel,89.0,67.8,88.8,87.9,86.8,90.0
Nancy Coulton,78.7.88.93.8,87.5,78.8,90.2 Sureka Bandara,90.7,91.2,78,4,90.4,92.0,94.7
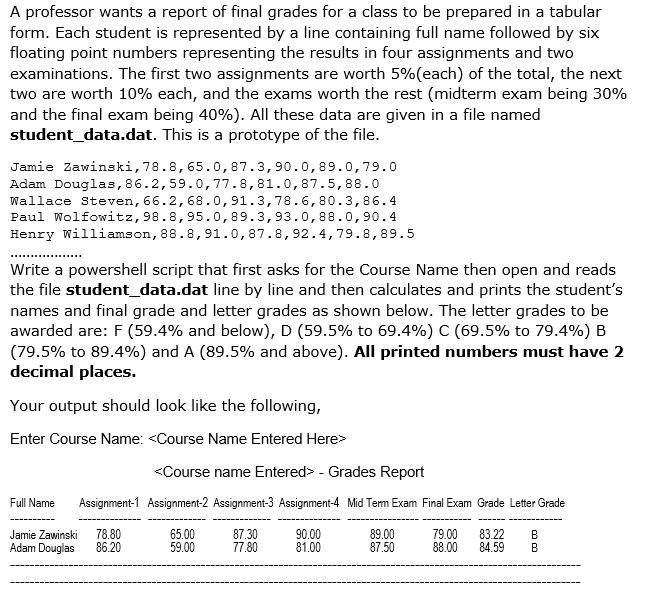
A professor wants a report of final grades for a class to be prepared in a tabular form. Each student is represented by a line containing full name followed by six floating point numbers representing the results in four assignments and two examinations. The first two assignments are worth 5%(each) of the total, the next two are worth 10% each, and the exams worth the rest (midterm exam being 30% and the final exam being 40%). All these data are given in a file named student_data.dat. This is a prototype of the file Jamie Zawinski,78.8,65.0,87.3,90.0,89.0,79.0 Adam Douglas, 86.2,59.0,77.8,81.0,87.5,88.0 Wallace Steven, 66.2,68.0,91.3,78.6, 80.3,86.4 Paul Wolfowitz, 98.8,95.0, 89.3,93.0,88.0,90.4 Henry Williamson, 88.8,91.0,87.8,92.4,79.8,89.5 Write a powershell script that first asks for the Course Name then open and reads the file student data.dat line by line and then calculates and prints the student's names and final grade and letter grades as shown below. The letter grades to be awarded are: F (59.4% and below), D (59.5% to 69.4%) C (69.5% to 79.4%) B (79.5% to 89.4%) and A (89.5% and above). All printed numbers must have 2 decimal places. Your output should look like the following Enter Course Name:
Step by Step Solution
There are 3 Steps involved in it

Get step-by-step solutions from verified subject matter experts