

Question: A class produced the graph below when they plotted mass vs. volume for samples of two solids. A 6.6g piece of solid B was rolled
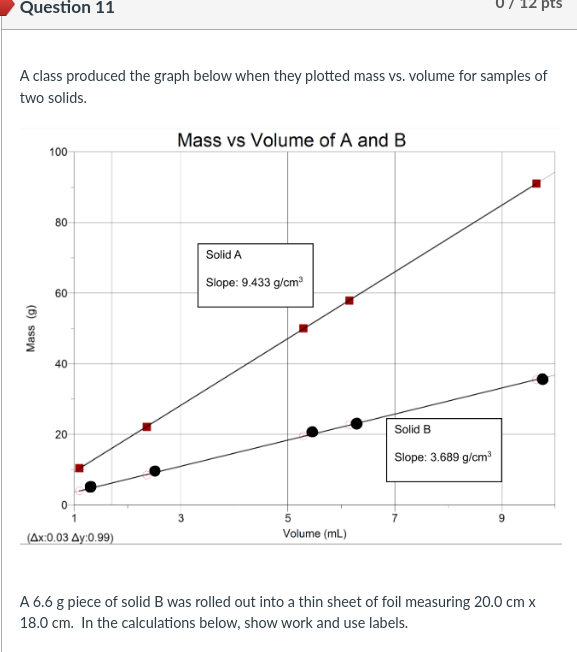
A class produced the graph below when they plotted mass vs. volume for samples of two solids. A 6.6g piece of solid B was rolled out into a thin sheet of foil measuring 20.0cmx 18.0cm. In the calculations below, show work and use labels
Step by Step Solution
There are 3 Steps involved in it
1 Expert Approved Answer
Step: 1 Unlock

Question Has Been Solved by an Expert!
Get step-by-step solutions from verified subject matter experts
Step: 2 Unlock
Step: 3 Unlock