

Question: A class produced the graph below when they plotted mass vs. volume for samples of two solids. Suppose you have a 100g sample of solid
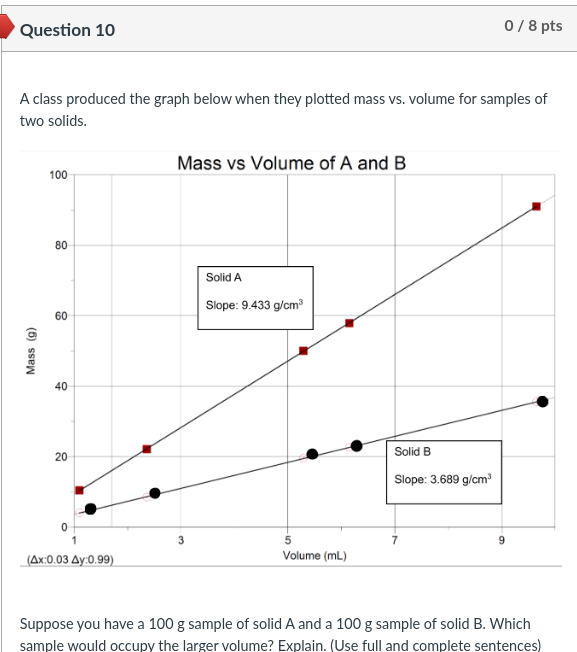
A class produced the graph below when they plotted mass vs. volume for samples of two solids. Suppose you have a 100g sample of solid A and a 100g sample of solid B. Which sample would occupy the larger volume? Explain. (Use full and complete sentences)
Step by Step Solution
There are 3 Steps involved in it
1 Expert Approved Answer
Step: 1 Unlock

Question Has Been Solved by an Expert!
Get step-by-step solutions from verified subject matter experts
Step: 2 Unlock
Step: 3 Unlock