

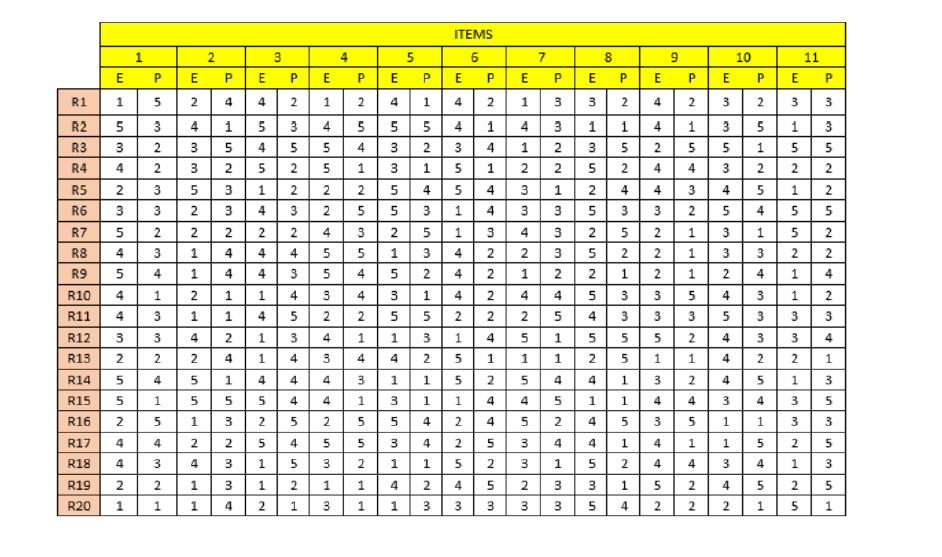
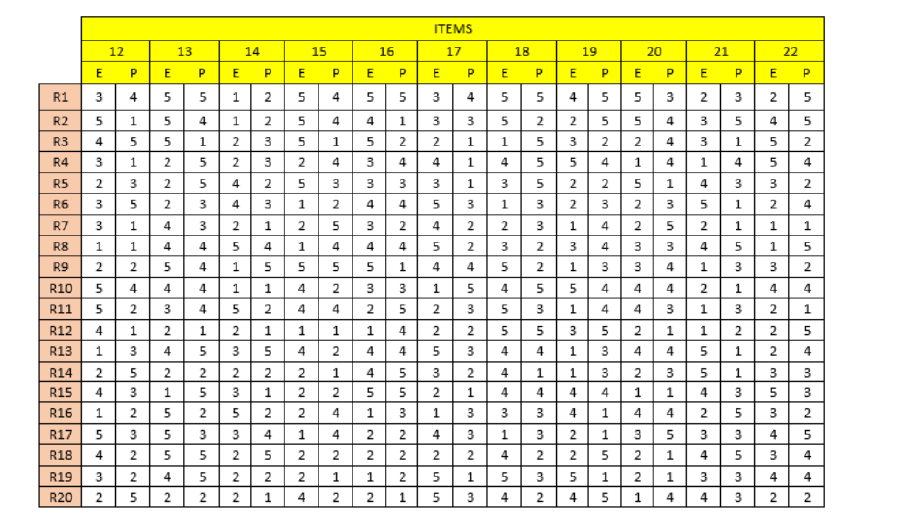
Question: A clear data is shown below: Question 3 After performing the focus group discussion with customers, the management of KPG Healthcare Berhad now have key
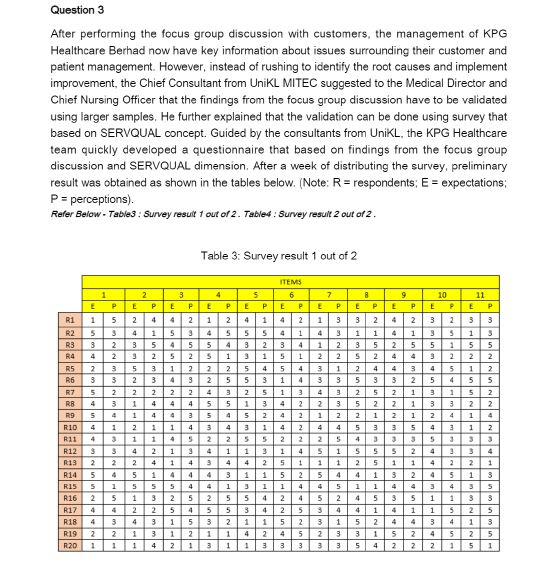

A clear data is shown below:
Step by Step Solution
There are 3 Steps involved in it
1 Expert Approved Answer
Step: 1 Unlock

Question Has Been Solved by an Expert!
Get step-by-step solutions from verified subject matter experts
Step: 2 Unlock
Step: 3 Unlock