

A clinical trial was conducted to test the effectiveness of a drug for treating insomnia in...
Fantastic news! We've Found the answer you've been seeking!
Question:


Transcribed Image Text:
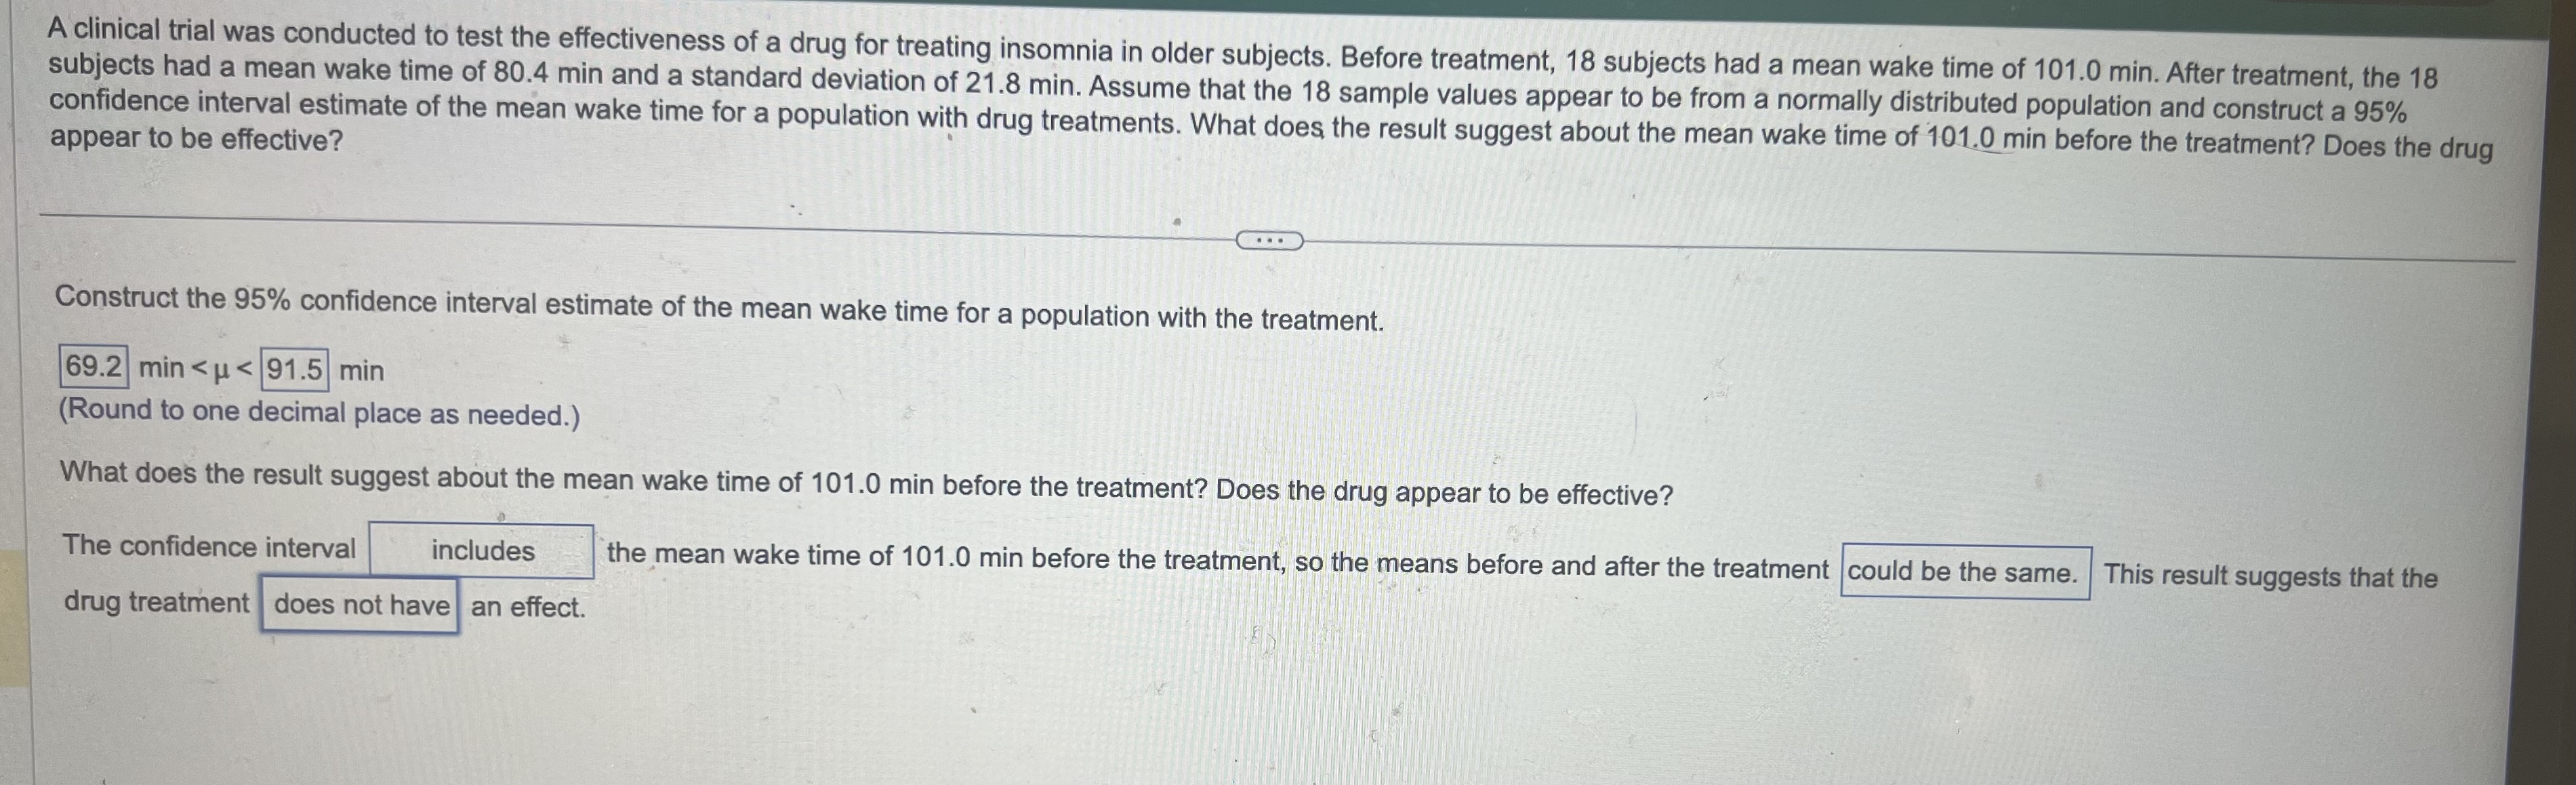
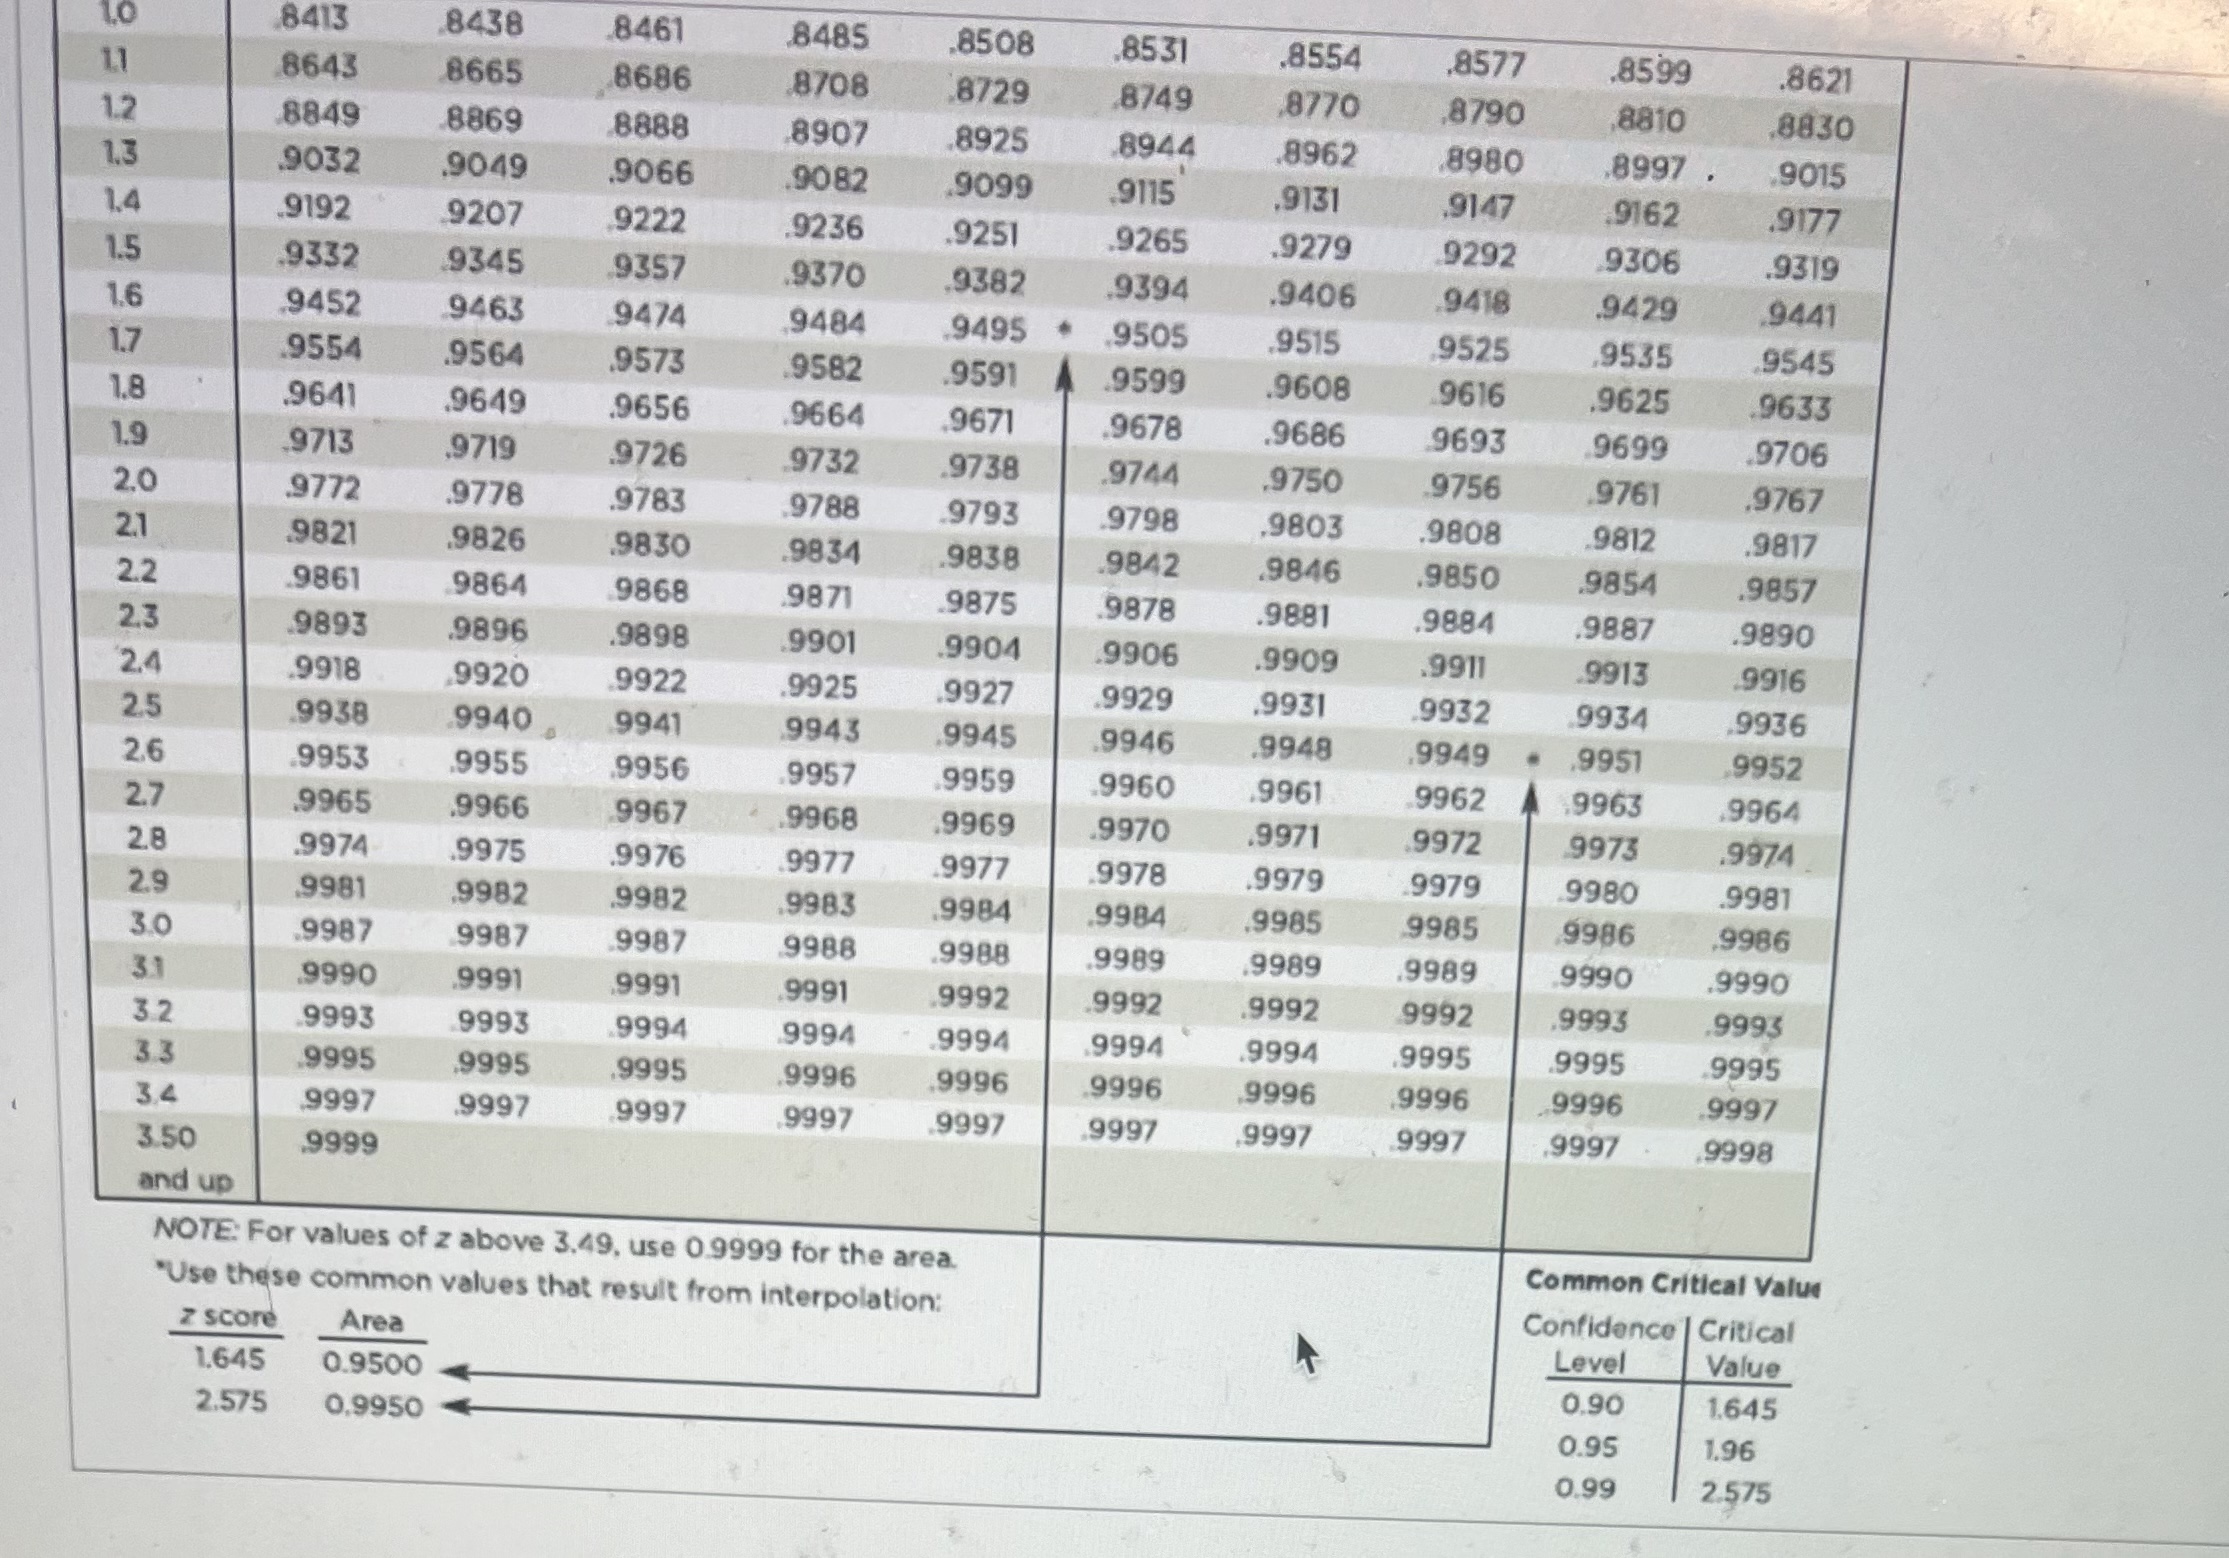
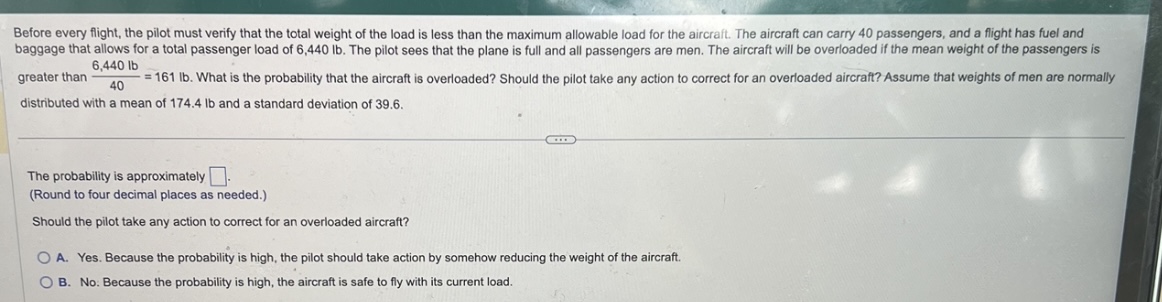
A clinical trial was conducted to test the effectiveness of a drug for treating insomnia in older subjects. Before treatment, 18 subjects had a mean wake time of 101.0 min. After treatment, the 18 subjects had a mean wake time of 80.4 min and a standard deviation of 21.8 min. Assume that the 18 sample values appear to be from a normally distributed population and construct a 95% confidence interval estimate of the mean wake time for a population with drug treatments. What does the result suggest about the mean wake time of 101.0 min before the treatment? Does the drug appear to be effective? Construct the 95% confidence interval estimate of the mean wake time for a population with the treatment. 69.2 min < < 91.5 min (Round to one decimal place as needed.) What does the result suggest about the mean wake time of 101.0 min before the treatment? Does the drug appear to be effective? The confidence interval includes drug treatment does not have an effect. the mean wake time of 101.0 min before the treatment, so the means before and after the treatment could be the same. This result suggests that the 1.0 8413 .8438 .8461 .8485 .8508 .8531 .8554 .8577 .8599 .8621 1.1 8643 8665 8686 8708 8729 8749 .8770 .8790 .8810 .8830 1.2 8849 .8869 8888 .8907 .8925 .8944 .8962 .8980 .8997. .9015 1.3 .9032 .9049 .9066 .9082 .9099 9115 .9131 .9147 .9162 .9177 1.4 .9192 .9207 9222 .9236 .9251 .9265 .9279 .9292 .9306 .9319 1.5 .9332 .9345 .9357 .9370 .9382 .9394 .9406 .9418 .9429 .9441 1.6 .9452 9463 9474 9484 .9495 9505 .9515 9525 .9535 .9545 1.7 .9554 .9564 .9573 .9582 .9591 .9599 .9608 .9616 .9625 .9633 1.8 .9641 .9649 .9656 .9664 .9671 .9678 .9686 9693 .9699 .9706 1.9 9713 .9719 .9726 9732 .9738 .9744 .9750 9756 .9761 .9767 2.0 .9772 .9778 .9783 .9788 .9793 .9798 .9803 .9808 .9812 .9817 2.1 .9821 .9826 .9830 .9834 .9838 .9842 .9846 .9850 .9854 .9857 2.2 .9861 9864 .9868 .9871 .9875 .9878 .9881 .9884 .9887 .9890 2.3 .9893 .9896 .9898 .9901 .9904 .9906 .9909 .9911 .9913 .9916 2.4 .9918 9920 .9922 .9925 .9927 .9929 .9931 .9932 .9934 .9936 2.5 9938 .9940 9941 9943 .9945 .9946 .9948 .9949 .9951 9952 2.6 9953 .9955 .9956 .9957 .9959 .9960 .9961 9962 .9963 9964 2.7 .9965 .9966 .9967 .9968 .9969 .9970 .9971 .9972 9973 .9974 2.8 9974 .9975 .9976 .9977 .9977 .9978 .9979 .9979 .9980 .9981 2.9 9981 .9982 .9982 .9983 .9984 .9984 .9985 9985 9986 .9986 3.0 .9987 9987 .9987 9988 .9988 .9989 .9989 .9989 9990 .9990 3.1 9990 .9991 .9991 .9991 .9992 .9992 .9992 9992 .9993 .9993 3.2 .9993 .9993 .9994 9994 .9994 .9994 .9994 .9995 .9995 .9995 3.3 .9995 .9995 .9995 .9996 .9996 .9996 .9996 .9996 9996 .9997 3.4 9997 .9997 9997 .9997 .9997 .9997 .9997 .9997 .9997 .9998 3.50 9999 and up NOTE: For values of z above 3.49, use 0.9999 for the area. "Use these common values that result from interpolation: z score Area 1.645 0.9500 2.575 0.9950 Common Critical Value Confidence Critical Level Value 0.90 1.645 0.95 1.96 0.99 2.575 Before every flight, the pilot must verify that the total weight of the load is less than the maximum allowable load for the aircraft. The aircraft can carry 40 passengers, and a flight has fuel and baggage that allows for a total passenger load of 6,440 lb. The pilot sees that the plane is full and all passengers are men. The aircraft will be overloaded if the mean weight of the passengers is 6,440 lb greater than 40 =161 lb. What is the probability that the aircraft is overloaded? Should the pilot take any action to correct for an overloaded aircraft? Assume that weights of men are normally distributed with a mean of 174.4 lb and a standard deviation of 39.6. The probability is approximately . (Round to four decimal places as needed.) Should the pilot take any action to correct for an overloaded aircraft? OA. Yes. Because the probability is high, the pilot should take action by somehow reducing the weight of the aircraft. OB. No. Because the probability is high, the aircraft is safe to fly with its current load. Find the indicated critical value. 20.04 Click to view page 1 of the table. Click to view page 2 of the table 20.04= (Round to two decimal places as needed.) Standard Normal Table (Page 2) Standard Normal (z) Distribution: Cumulative Area from the LEFT N .00 .01 .02 .03 .04 .05 .06 .07 .08 .09 0.0 5000 .5040 .5080 .5120 .5160 5199 .5239 .5279 .5319 0.1 .5398 .5359 .5438 .5478 .5517 .5557 .5596 .5636 .5675 .5714 0.2 .5753 .5793 .5832 .5871 5910 .5948 .5987 .6026 .6064 .6103 .6141 0.3 .6179 .6217 .6255 .6293 .6331 .6368 .6406 .6443 6480 .6517 0.4 .6554 .6591 .6628 .6664 .6700 .6736 .6772 .6808 6844 0.5 .6879 .6915 .6950 .6985 .7019 .7054 .7088 .7123 .7157 .7190 .7224 0.6 .7257 .7291 .7324 .7357 3.7389 .7422 .7454 .7486 .7517 .7549 0,7 .7580 .7611 .7642 .7673 .7704 7734 .7764 .7794 .7823 .7852 0.8 .7881 .7910 .7939 .7967 .7995 .8023 .8051 8078 .8106 .8133 0.9 .8159 .8186 .8212 .8238 .8264 .8289 .8315 .8340 .8365 .8389 1.0 .8413 .8438 .8461 .8485 .8508 .8531 .8554 .8577 .8599 .8621 1.1 .8643 .8665 8686 .8708 .8729 .8749 .8770 .8790 .8810 .8830 1.2 .8849 .8869 8888 ..8907 .8925 .8944 .8962 .8980 .8997 .9015 1.3 .9032 .9049 .9066 .9082 .9099 .9115 .9131 .9147 .9162 .9177 1.4 .9192 .9207 9222 .9236 .9251 .9265 .9279 .9292 9306 .9319 1.5 .9332 .9345 .9357 .9370 .9382 .9394 .9406 .9418 .9429 .9441 1.6 9452 .9463 .9474 .9484 .9495 * 9505 .9515 .9525 .9535 .9545 1.7 .9554 .9564 .9573 .9582 .9591 9599 .9608 .9616 .9625 .9633 1.8 .9641 .9649 .9656 .9664 .9671 .9678 .9686 9693 .9699 .9706 1.9 .9713 .9719 .9726 .9732 .9738 .9744 .9750 .9756 .9761 .9767 2.0 9772 .9778 .9783 .9788 .9793 .9798 .9803 .9808 .9812 ,9817 2.1 .9821 .9826 .9830 .9834 .9838 .9842 .9846 .9850 .9854 .9857 2.2 .9861 .9864 9868 .9871 .9875 .9878 .9881 .9884 .9887 .9890 2.3 9893 .9896 .9898 .9901 .9904 9906 .9909 .9911 .9913 .9916 2.4 9918 .9920 .9922 .9925 .9927 .9929 .9931 .9932 .9934 .9936 2.5 9938 .9940 .9941 .9943 .9945 9946 19948 .9949 .9951 .9952 2.6 .9953 .9955 .9956 .9957 .9959 .9960 .9961 .9962 .9963 .9964 2.7 .9965 .9966 .9967 .9968 .9969 .9970 .9971 .9972 9973 .9974 2.8 9974 .9975 .9976 .9977 .9977 .9978 .9979 .9979 .9980 .9981 Print Done Find the area of the shaded region. The graph to the right depicts IQ scores of adults, and those scores are normally distributed with a mean of 100 and a standard deviation of 15. The area of the shaded region is (Round to four decimal places as needed.) 98 Assume that a randomly selected subject is given a bone density test. Those test scores are normally distributed with a mean of 0 and a standard deviation of 1. Find the probability that a given score is between -2.19 and 3.72 and draw a sketch of the region. Sketch the region. Choose the correct graph below. OA. 2.19 3.72 The probability is (Round to four decimal places as needed.) B. -2.19 3.72 C. -2.19 3.72 G O D. a -2.19 3.72 Q G A clinical trial was conducted to test the effectiveness of a drug for treating insomnia in older subjects. Before treatment, 18 subjects had a mean wake time of 101.0 min. After treatment, the 18 subjects had a mean wake time of 80.4 min and a standard deviation of 21.8 min. Assume that the 18 sample values appear to be from a normally distributed population and construct a 95% confidence interval estimate of the mean wake time for a population with drug treatments. What does the result suggest about the mean wake time of 101.0 min before the treatment? Does the drug appear to be effective? Construct the 95% confidence interval estimate of the mean wake time for a population with the treatment. 69.2 min < < 91.5 min (Round to one decimal place as needed.) What does the result suggest about the mean wake time of 101.0 min before the treatment? Does the drug appear to be effective? The confidence interval includes drug treatment does not have an effect. the mean wake time of 101.0 min before the treatment, so the means before and after the treatment could be the same. This result suggests that the 1.0 8413 .8438 .8461 .8485 .8508 .8531 .8554 .8577 .8599 .8621 1.1 8643 8665 8686 8708 8729 8749 .8770 .8790 .8810 .8830 1.2 8849 .8869 8888 .8907 .8925 .8944 .8962 .8980 .8997. .9015 1.3 .9032 .9049 .9066 .9082 .9099 9115 .9131 .9147 .9162 .9177 1.4 .9192 .9207 9222 .9236 .9251 .9265 .9279 .9292 .9306 .9319 1.5 .9332 .9345 .9357 .9370 .9382 .9394 .9406 .9418 .9429 .9441 1.6 .9452 9463 9474 9484 .9495 9505 .9515 9525 .9535 .9545 1.7 .9554 .9564 .9573 .9582 .9591 .9599 .9608 .9616 .9625 .9633 1.8 .9641 .9649 .9656 .9664 .9671 .9678 .9686 9693 .9699 .9706 1.9 9713 .9719 .9726 9732 .9738 .9744 .9750 9756 .9761 .9767 2.0 .9772 .9778 .9783 .9788 .9793 .9798 .9803 .9808 .9812 .9817 2.1 .9821 .9826 .9830 .9834 .9838 .9842 .9846 .9850 .9854 .9857 2.2 .9861 9864 .9868 .9871 .9875 .9878 .9881 .9884 .9887 .9890 2.3 .9893 .9896 .9898 .9901 .9904 .9906 .9909 .9911 .9913 .9916 2.4 .9918 9920 .9922 .9925 .9927 .9929 .9931 .9932 .9934 .9936 2.5 9938 .9940 9941 9943 .9945 .9946 .9948 .9949 .9951 9952 2.6 9953 .9955 .9956 .9957 .9959 .9960 .9961 9962 .9963 9964 2.7 .9965 .9966 .9967 .9968 .9969 .9970 .9971 .9972 9973 .9974 2.8 9974 .9975 .9976 .9977 .9977 .9978 .9979 .9979 .9980 .9981 2.9 9981 .9982 .9982 .9983 .9984 .9984 .9985 9985 9986 .9986 3.0 .9987 9987 .9987 9988 .9988 .9989 .9989 .9989 9990 .9990 3.1 9990 .9991 .9991 .9991 .9992 .9992 .9992 9992 .9993 .9993 3.2 .9993 .9993 .9994 9994 .9994 .9994 .9994 .9995 .9995 .9995 3.3 .9995 .9995 .9995 .9996 .9996 .9996 .9996 .9996 9996 .9997 3.4 9997 .9997 9997 .9997 .9997 .9997 .9997 .9997 .9997 .9998 3.50 9999 and up NOTE: For values of z above 3.49, use 0.9999 for the area. "Use these common values that result from interpolation: z score Area 1.645 0.9500 2.575 0.9950 Common Critical Value Confidence Critical Level Value 0.90 1.645 0.95 1.96 0.99 2.575 Before every flight, the pilot must verify that the total weight of the load is less than the maximum allowable load for the aircraft. The aircraft can carry 40 passengers, and a flight has fuel and baggage that allows for a total passenger load of 6,440 lb. The pilot sees that the plane is full and all passengers are men. The aircraft will be overloaded if the mean weight of the passengers is 6,440 lb greater than 40 =161 lb. What is the probability that the aircraft is overloaded? Should the pilot take any action to correct for an overloaded aircraft? Assume that weights of men are normally distributed with a mean of 174.4 lb and a standard deviation of 39.6. The probability is approximately . (Round to four decimal places as needed.) Should the pilot take any action to correct for an overloaded aircraft? OA. Yes. Because the probability is high, the pilot should take action by somehow reducing the weight of the aircraft. OB. No. Because the probability is high, the aircraft is safe to fly with its current load. Find the indicated critical value. 20.04 Click to view page 1 of the table. Click to view page 2 of the table 20.04= (Round to two decimal places as needed.) Standard Normal Table (Page 2) Standard Normal (z) Distribution: Cumulative Area from the LEFT N .00 .01 .02 .03 .04 .05 .06 .07 .08 .09 0.0 5000 .5040 .5080 .5120 .5160 5199 .5239 .5279 .5319 0.1 .5398 .5359 .5438 .5478 .5517 .5557 .5596 .5636 .5675 .5714 0.2 .5753 .5793 .5832 .5871 5910 .5948 .5987 .6026 .6064 .6103 .6141 0.3 .6179 .6217 .6255 .6293 .6331 .6368 .6406 .6443 6480 .6517 0.4 .6554 .6591 .6628 .6664 .6700 .6736 .6772 .6808 6844 0.5 .6879 .6915 .6950 .6985 .7019 .7054 .7088 .7123 .7157 .7190 .7224 0.6 .7257 .7291 .7324 .7357 3.7389 .7422 .7454 .7486 .7517 .7549 0,7 .7580 .7611 .7642 .7673 .7704 7734 .7764 .7794 .7823 .7852 0.8 .7881 .7910 .7939 .7967 .7995 .8023 .8051 8078 .8106 .8133 0.9 .8159 .8186 .8212 .8238 .8264 .8289 .8315 .8340 .8365 .8389 1.0 .8413 .8438 .8461 .8485 .8508 .8531 .8554 .8577 .8599 .8621 1.1 .8643 .8665 8686 .8708 .8729 .8749 .8770 .8790 .8810 .8830 1.2 .8849 .8869 8888 ..8907 .8925 .8944 .8962 .8980 .8997 .9015 1.3 .9032 .9049 .9066 .9082 .9099 .9115 .9131 .9147 .9162 .9177 1.4 .9192 .9207 9222 .9236 .9251 .9265 .9279 .9292 9306 .9319 1.5 .9332 .9345 .9357 .9370 .9382 .9394 .9406 .9418 .9429 .9441 1.6 9452 .9463 .9474 .9484 .9495 * 9505 .9515 .9525 .9535 .9545 1.7 .9554 .9564 .9573 .9582 .9591 9599 .9608 .9616 .9625 .9633 1.8 .9641 .9649 .9656 .9664 .9671 .9678 .9686 9693 .9699 .9706 1.9 .9713 .9719 .9726 .9732 .9738 .9744 .9750 .9756 .9761 .9767 2.0 9772 .9778 .9783 .9788 .9793 .9798 .9803 .9808 .9812 ,9817 2.1 .9821 .9826 .9830 .9834 .9838 .9842 .9846 .9850 .9854 .9857 2.2 .9861 .9864 9868 .9871 .9875 .9878 .9881 .9884 .9887 .9890 2.3 9893 .9896 .9898 .9901 .9904 9906 .9909 .9911 .9913 .9916 2.4 9918 .9920 .9922 .9925 .9927 .9929 .9931 .9932 .9934 .9936 2.5 9938 .9940 .9941 .9943 .9945 9946 19948 .9949 .9951 .9952 2.6 .9953 .9955 .9956 .9957 .9959 .9960 .9961 .9962 .9963 .9964 2.7 .9965 .9966 .9967 .9968 .9969 .9970 .9971 .9972 9973 .9974 2.8 9974 .9975 .9976 .9977 .9977 .9978 .9979 .9979 .9980 .9981 Print Done Find the area of the shaded region. The graph to the right depicts IQ scores of adults, and those scores are normally distributed with a mean of 100 and a standard deviation of 15. The area of the shaded region is (Round to four decimal places as needed.) 98 Assume that a randomly selected subject is given a bone density test. Those test scores are normally distributed with a mean of 0 and a standard deviation of 1. Find the probability that a given score is between -2.19 and 3.72 and draw a sketch of the region. Sketch the region. Choose the correct graph below. OA. 2.19 3.72 The probability is (Round to four decimal places as needed.) B. -2.19 3.72 C. -2.19 3.72 G O D. a -2.19 3.72 Q G
Expert Answer:

Posted Date:
Students also viewed these mathematics questions
-
Have I done this correctly? In case you were wondering what experiment I was doing, it is the magic milk experiment about how food color moves away from the dish soap in a bowl of milk. EPS Unit 1...
-
The following section is taken from Ohlman Corp.s balance sheet at December 31, 2013. Current liabilities Interest payable ................ $ 56,000 Long-term liabilities Bonds payable, 7%, due...
-
Does national culture influence the meaning of intellectual property? That is, in a culture where community is stressed, rather than the individual,would you expect intellectual property rights to be...
-
Why might auditors be asked to perform an efficiency evaluation of a computer system?
-
1. Using the Big Five personality factors, describe Ellisons personality characteristics. How do these affect others? 2. Whats Ellison EQ? Why do individuals work for him? MINI CASE Larry Ellison,...
-
Problem B-85 Derive the transfer function X,(s)/X (s) of the mechanical system shown in Figure 8-25. Then obtain the response .x,() when the input .x,() is a pulse signal given by x(1) = X; = 0 0
-
Break-even analysis is a technique widely used by production management and management accountants. Break-even analysis gives managers an idea of the minimum number of units it needs to sell in order...
-
if x and y are integers and their values can be between 0 lesser than x lesser then 5 0 lesser than y lesser than 4 What are all the integer values for - 2x + y
-
What will be the output of the following Java code? 1. class operators public static void main(String args[]) 2. { 3. 4. { 5. 6. 7. 8. 9. 10. } 11. } int var1 = 5; int var2 6; int var3; = var3 = ++...
-
In game theory, a firm under "(non-corporative) simultaneous game" may make a strategic commitment so as to change the situation from simultaneous game to "sequential game" in which it plays a role...
-
Please use the financial statements for Youth Without Shelter (YWS) 2020-21 fiscal year. You can find them at the Youth Without Shelter website under Who We Are - Financials. YWS's operates an...
-
Problem 1: Your company is considering a project with an initial cash outlay of $500,000. The discount rate is 10%. Projected cash inflows for the next 5 years are: Year 1: $100,000; Year 2:...
-
If a PlayStation 4 Pro costs 40,000 yen in Japan, how much will it cost in U.S. dollars if the exchange rate is as follows? Instructions: Round your responses to two decimal places. a. 90 yen = $1...
-
Pearl Medavoy will invest $10,240 a year for 20 years in a fund that will earn 10% annual interest. . If the first payment into the fund occurs today, what amount will be in the fund in 20 years? If...

Study smarter with the SolutionInn App