

Question: A common way to value timeshare/vacation companies is by using EBITDA and EBIT multiples. Using these valuation methods, what is your enterprise value estimate of
-
A common way to value timeshare/vacation companies is by using EBITDA and EBIT multiples. Using these valuation methods, what is your enterprise value estimate of HGV(Hilton Grand Vacations)? What is the enterprise value of the new HGV(Hilton Grand Vacations) based on revenues and earnings multiples? What do you believe is reasonable estimate of value for HGV?
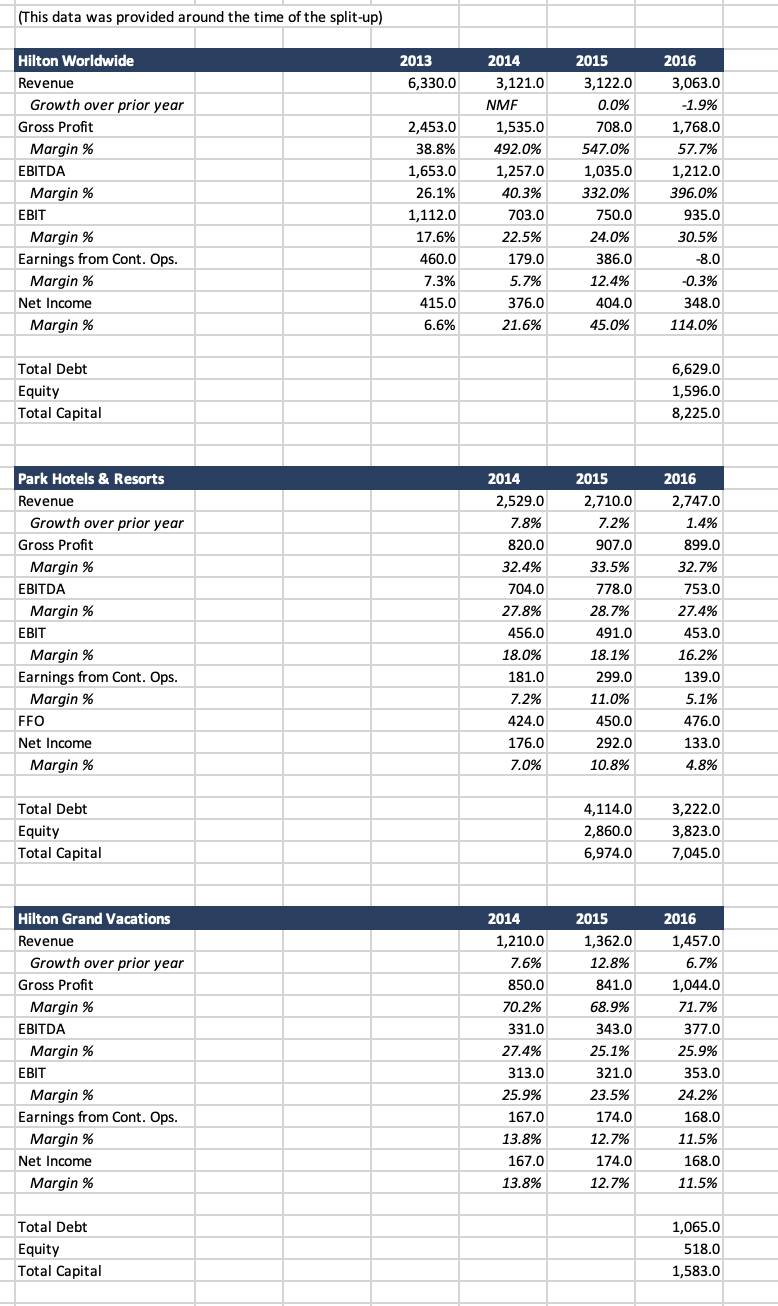
(This data was provided around the time of the split-up) 2013 6,330.0 Hilton Worldwide Revenue Growth over prior year Gross Profit Margin % EBITDA Margin % EBIT Margin % Earnings from Cont. Ops. Margin % Net Income Margin % 2,453.0 38.8% 1,653.0 26.1% 1,112.0 17.6% 460.0 7.3% 415.0 6.6% 2014 3,121.0 NMF 1,535.0 492.0% 1,257.0 40.3% 703.0 22.5% 179.0 5.7% 376.0 21.6% 2015 3,122.0 0.0% 708.0 547.0% 1,035.0 332.0% 750.0 24.0% 386.0 12.4% 404.0 45.0% 2016 3,063.0 -1.9% 1,768.0 57.7% 1,212.0 396.0% 935.0 30.5% -8.0 -0.3% 348.0 114.0% Total Debt Equity Total Capital 6,629.0 1,596.0 8,225.0 Park Hotels & Resorts Revenue Growth over prior year Gross Profit Margin % EBITDA Margin % EBIT Margin % Earnings from Cont. Ops. Margin % FFO Net Income Margin % 2014 2,529.0 7.8% 820.0 32.4% 704.0 27.8% 456.0 18.0% 181.0 7.2% 424.0 176.0 7.0% 2015 2,710.0 7.2% 907.0 33.5% 778.0 28.7% 491.0 18.1% 299.0 11.0% 450.0 292.0 10.8% 2016 2,747.0 1.4% 899.0 32.7% 753.0 27.4% 453.0 16.2% 139.0 5.1% 476.0 133.0 4.8% Total Debt Equity Total Capital 4,114.0 2,860.0 6,974.0 3,222.0 3,823.0 7,045.0 2014 Hilton Grand Vacations Revenue Growth over prior year Gross Profit Margin % EBITDA Margin % EBIT Margin % Earnings from Cont. Ops. Margin % Net Income Margin % 1,210.0 7.6% 850.0 70.2% 331.0 27.4% 313.0 25.9% 167.0 13.8% 2015 1,362.0 12.8% 841.0 68.9% 343.0 25.1% 321.0 23.5% 174.0 12.7% 174.0 12.7% 2016 1,457.0 6.7% 1,044.0 71.7% 377.0 25.9% 353.0 24.2% 168.0 11.5% 168.0 11.5% 167.0 13.8% Total Debt Equity Total Capital 1,065.0 518.0 1,583.0 (This data was provided around the time of the split-up) 2013 6,330.0 Hilton Worldwide Revenue Growth over prior year Gross Profit Margin % EBITDA Margin % EBIT Margin % Earnings from Cont. Ops. Margin % Net Income Margin % 2,453.0 38.8% 1,653.0 26.1% 1,112.0 17.6% 460.0 7.3% 415.0 6.6% 2014 3,121.0 NMF 1,535.0 492.0% 1,257.0 40.3% 703.0 22.5% 179.0 5.7% 376.0 21.6% 2015 3,122.0 0.0% 708.0 547.0% 1,035.0 332.0% 750.0 24.0% 386.0 12.4% 404.0 45.0% 2016 3,063.0 -1.9% 1,768.0 57.7% 1,212.0 396.0% 935.0 30.5% -8.0 -0.3% 348.0 114.0% Total Debt Equity Total Capital 6,629.0 1,596.0 8,225.0 Park Hotels & Resorts Revenue Growth over prior year Gross Profit Margin % EBITDA Margin % EBIT Margin % Earnings from Cont. Ops. Margin % FFO Net Income Margin % 2014 2,529.0 7.8% 820.0 32.4% 704.0 27.8% 456.0 18.0% 181.0 7.2% 424.0 176.0 7.0% 2015 2,710.0 7.2% 907.0 33.5% 778.0 28.7% 491.0 18.1% 299.0 11.0% 450.0 292.0 10.8% 2016 2,747.0 1.4% 899.0 32.7% 753.0 27.4% 453.0 16.2% 139.0 5.1% 476.0 133.0 4.8% Total Debt Equity Total Capital 4,114.0 2,860.0 6,974.0 3,222.0 3,823.0 7,045.0 2014 Hilton Grand Vacations Revenue Growth over prior year Gross Profit Margin % EBITDA Margin % EBIT Margin % Earnings from Cont. Ops. Margin % Net Income Margin % 1,210.0 7.6% 850.0 70.2% 331.0 27.4% 313.0 25.9% 167.0 13.8% 2015 1,362.0 12.8% 841.0 68.9% 343.0 25.1% 321.0 23.5% 174.0 12.7% 174.0 12.7% 2016 1,457.0 6.7% 1,044.0 71.7% 377.0 25.9% 353.0 24.2% 168.0 11.5% 168.0 11.5% 167.0 13.8% Total Debt Equity Total Capital 1,065.0 518.0 1,583.0
Step by Step Solution
There are 3 Steps involved in it

Get step-by-step solutions from verified subject matter experts