

Question: The output response data y shown in Table E7.9 were generated from a step change in input u from 1 to 5 at time t
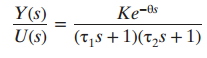
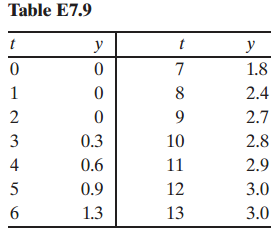
Y(s) Ke-0s (T,8 +1)(t,s + 1) U(s) Table E7.9 y t y 1.8 2.4 2.7 3 0.3 10 2.8 4 0.6 11 2.9 0.9 12 3.0 1.3 13 3.0
Step by Step Solution
★★★★★
3.40 Rating (175 Votes )
There are 3 Steps involved in it
1 Expert Approved Answer
Step: 1 Unlock

2 by inspection Use Smiths method to find 1 and 2 y 20 y0 02 y 0 02 3 06 From insp... View full answer
Question Has Been Solved by an Expert!
Get step-by-step solutions from verified subject matter experts
Step: 2 Unlock
Step: 3 Unlock
Document Format (2 attachments)
1602_606321ef16372_680098.pdf
180 KBs PDF File
1602_606321ef16372_680098.docx
120 KBs Word File