

Question: A company makes the following table which presents the problems in deliveries in January, February, March. a) Create a Pareto chart using the 3-month data.
A company makes the following table which presents the problems in deliveries in January, February, March.
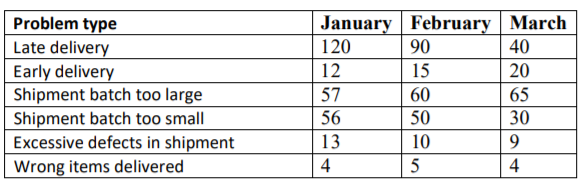
a) Create a Pareto chart using the 3-month data. (You can use Microsoft Excel, the combo chart or Pareto chart option depending on the version of your software)
b) If you wanted to find solutions to delivery problems, where would you begin and why?
c) Does your answer in part b change if you focus on each month separately? Why or why not?
Problem type Late delivery Early delivery Shipment batch too large Shipment batch too small Excessive defects in shipment Wrong items delivered January February March 120 90 40 12 15 20 57 60 65 56 50 30 13 10 9 4 5 4Step by Step Solution
There are 3 Steps involved in it
1 Expert Approved Answer
Step: 1 Unlock

Question Has Been Solved by an Expert!
Get step-by-step solutions from verified subject matter experts
Step: 2 Unlock
Step: 3 Unlock