

Question: A company stores revenue data in Amazon Redshift. A data analyst needs to create a dashboard so that the company's sales team can visualize historical
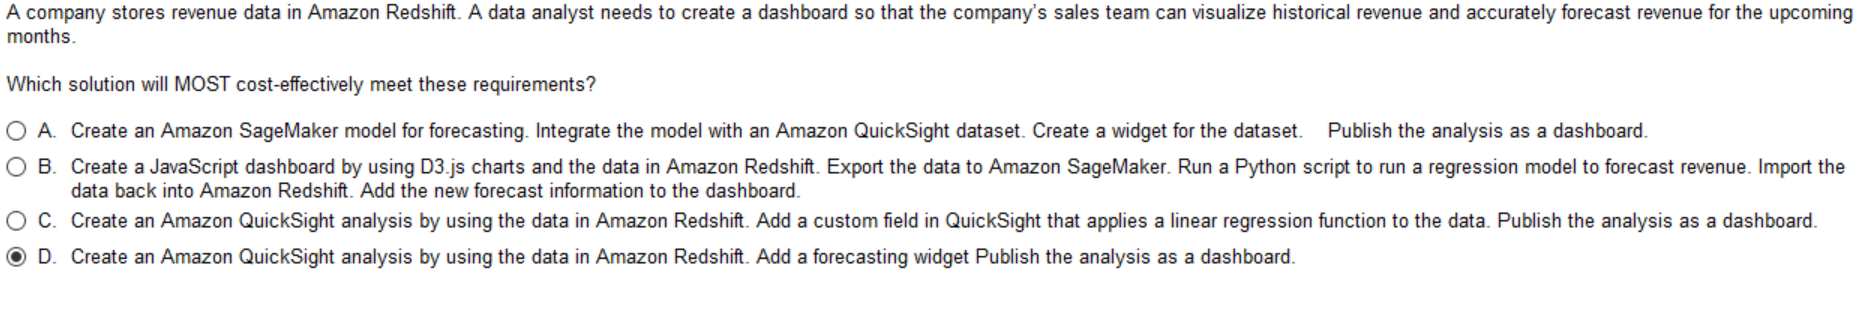
A company stores revenue data in Amazon Redshift. A data analyst needs to create a dashboard so that the company's sales team can visualize historical revenue and accurately forecast revenue for the upcoming months. Which solution will MOST cost-effectively meet these requirements? O A. Create an Amazon SageMaker model for forecasting. Integrate the model with an Amazon QuickSight dataset. Create a widget for the dataset. Publish the analysis as a dashboard. O B. Create a JavaScript dashboard by using D3.js charts and the data in Amazon Redshift. Export the data to Amazon SageMaker. Run a Python script to run a regression model to forecast revenue. Import the data back into Amazon Redshift. Add the new forecast information to the dashboard O C. Create an Amazon QuickSight analysis by using the data in Amazon Redshift. Add a custom field in QuickSight that applies a linear regression function to the data. Publish the analysis as a dashboard. O D. Create an Amazon QuickSight analysis by using the data in Amazon Redshift. Add a forecasting widget Publish the analysis as a dashboard
Step by Step Solution
There are 3 Steps involved in it

Get step-by-step solutions from verified subject matter experts