

Question: A comparable company can be Ebay, please help!!! Amazon.com Inc. Consolidated Income Statement US$ in millions 12 months ended Dec 31, 2019 Net product sales
A comparable company can be Ebay, please help!!!
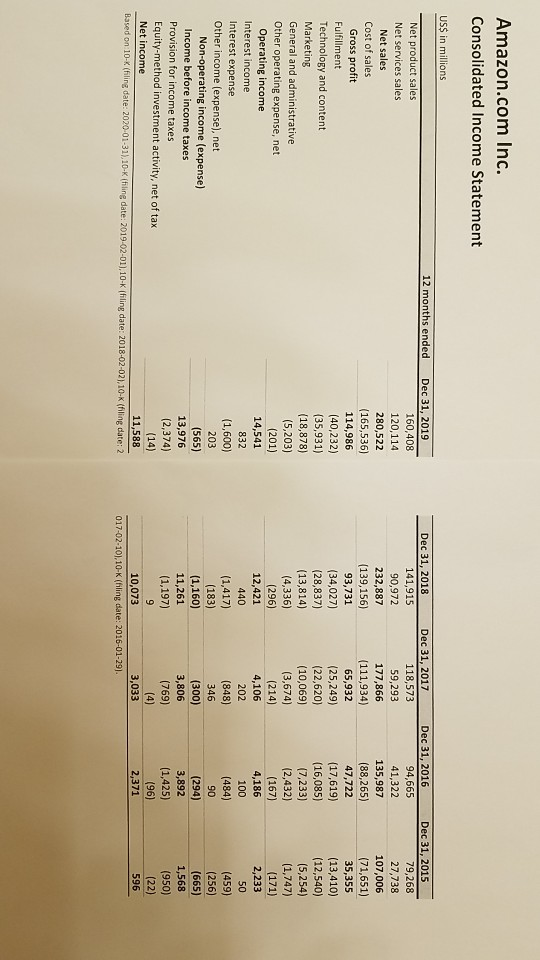
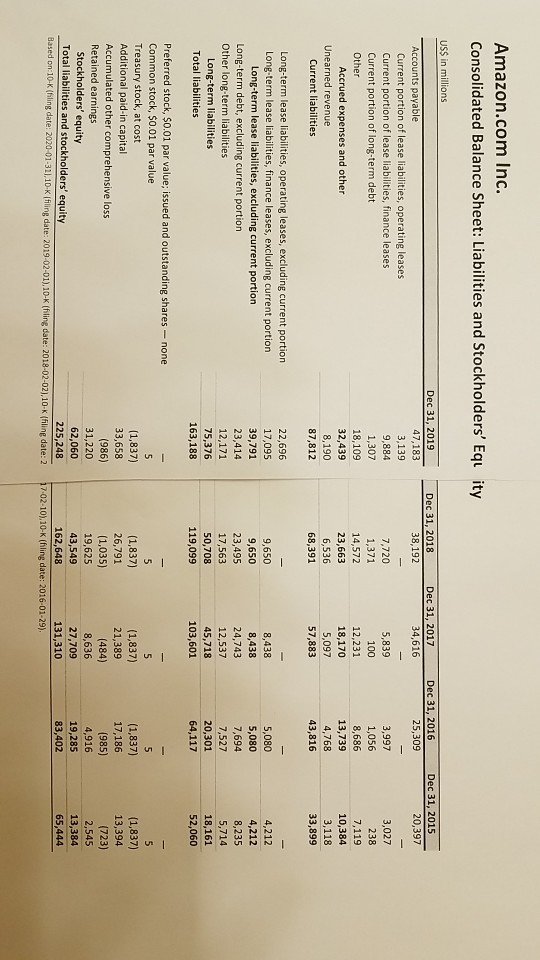
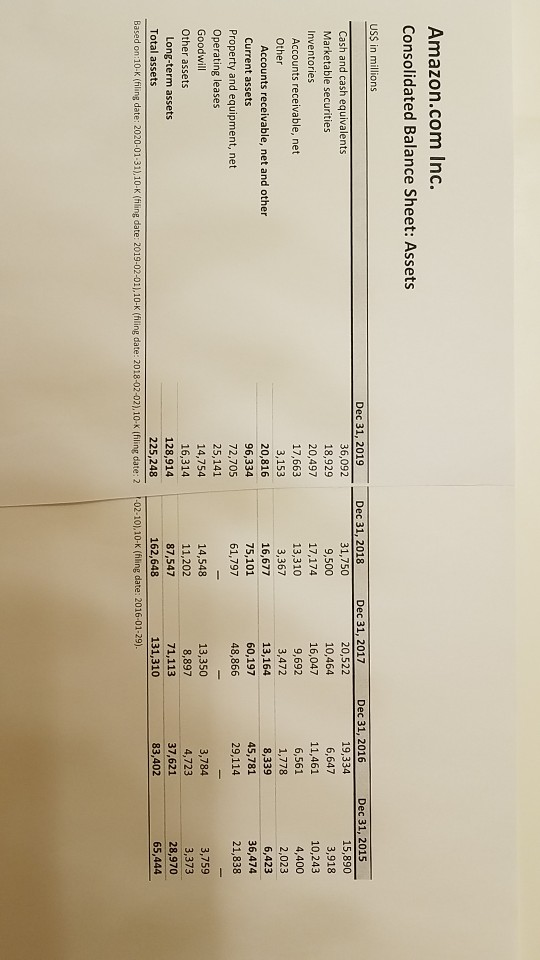
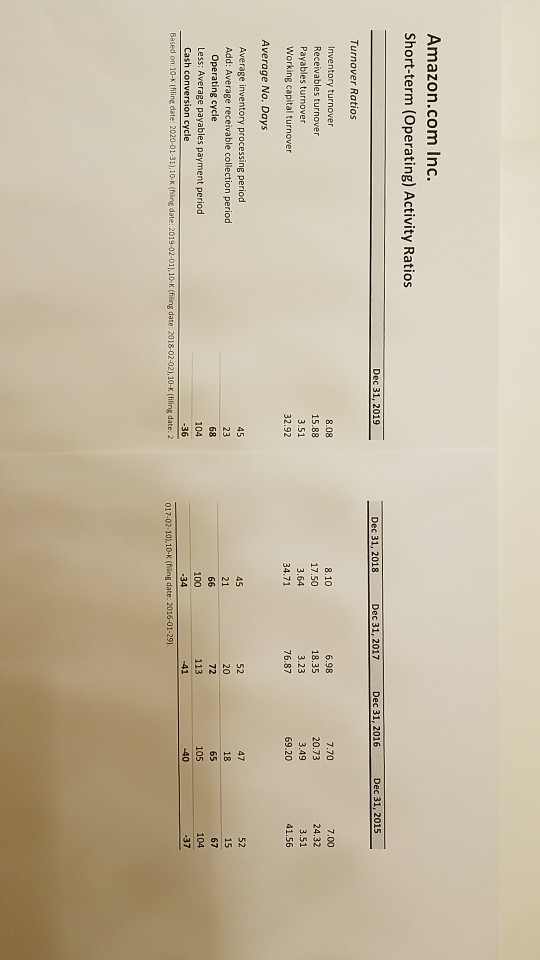
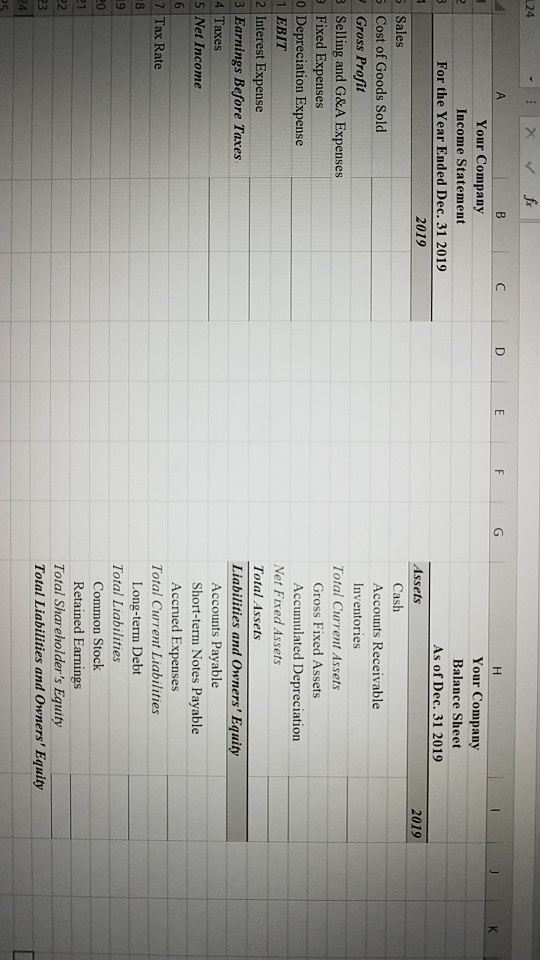
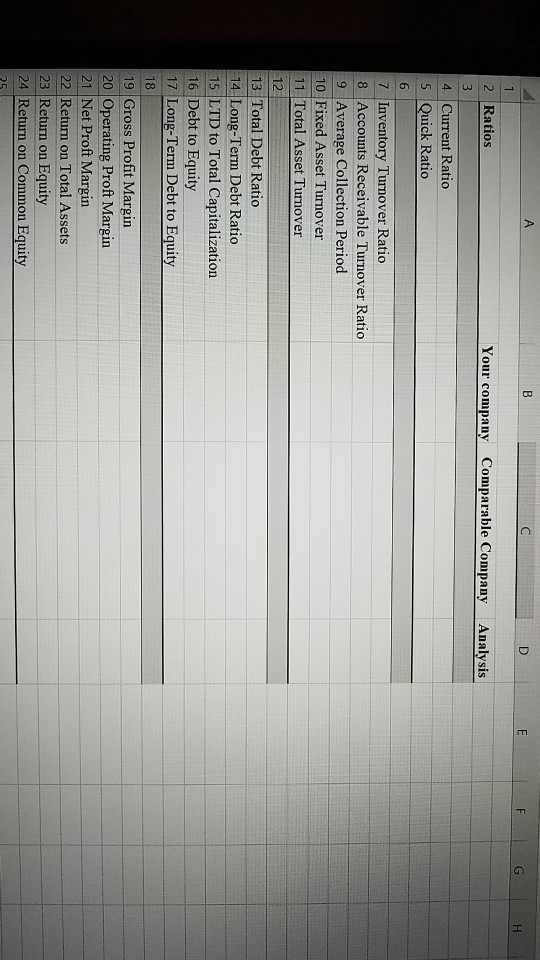
Amazon.com Inc. Consolidated Income Statement US$ in millions 12 months ended Dec 31, 2019 Net product sales 160,408 Net services sales 120,114 Net sales 280,522 Cost of sales (165,536) Gross profit 114,986 Fulfillment (40,232) Technology and content (35,931) Marketing (18,878) General and administrative (5,203) Other operating expense, net (201) Operating income 14,541 Interest income 832 Interest expense (1,600) Other income (expense), net 203 Non-operating income (expense) (565) Income before income taxes 13,976 Provision for income taxes (2,374) Equity-method investment activity, net of tax (14) Net income 11,588 Based on 10-K (Filing date: 2020-01-31),10-K filing date: 2019-02-01),10-K (filing date: 2018-02-02), 10-K (filing date: 2 Dec 31, 2018 Dec 31, 2017 141,915 118,573 90,972 59,293 232,887 177,866 (139,156) (111,934) 93,731 65,932 (34,027) (25,249) (28,837) (22,620) (13,814) (10,069) (4,336) (3,674) (296) (214) 12,421 4,106 440 202 (1,417) (848) (183) 346 (1,160) (300) 11,261 3,806 (1,197) (769) (4) 10,073 3,033 017-02-10),10-K (Filing date: 2016-01-29). Dec 31, 2016 94,665 41,322 135,987 (88,265) 47,722 (17,619) (16,085) (7,233) (2,432) (167) 4,186 100 (484) 90 (294) 3,892 (1,425) (96) Dec 31, 2015 79,268 27,738 107,006 (71,651) 35,355 (13,410) (12,540) (5,254) (1,747) (171) 2,233 50 (459) (256) (665) 1,568 (950) (22) 596 2,371 Amazon.com Inc. Consolidated Balance Sheet: Liabilities and Stockholders' Equity US$ in millions Dec 31, 2018 38,192 Dec 31, 2017 34,616 Dec 31, 2016 25,309 Dec 31, 2015 20,397 Accounts payable Current portion of lease liabilities, operating leases Current portion of lease liabilities, finance leases Current portion of long-term debt Other Accrued expenses and other Unearned revenue Current liabilities Dec 31, 2019 47,183 3,139 9,884 1,307 18,109 32,439 8,190 87,812 7,720 1,371 14,572 23,663 6,536 68,391 5,839 100 12,231 18,170 5,097 57,883 3,997 1,056 8,686 13,739 4,768 43,816 3,027 238 7,119 10,384 3,118 33,899 Long-term lease liabilities, operating leases, excluding current portion Long-term lease liabilities, finance leases, excluding current portion Long-term lease liabilities, excluding current portion Long-term debt, excluding current portion Other long-term liabilities Long-term liabilities Total liabilities 22,696 17,095 39,791 23,414 12,171 75,376 163,188 9,650 9,650 23,495 17,563 50,708 119,099 8,438 8,438 24,743 12,537 45,718 103,601 5,080 5,080 7,694 7,527 20,301 64,117 4,212 4,212 8,235 5,714 18,161 52,060 Preferred stock, $0.01 par value; issued and outstanding shares - none Common stock, $0.01 par value Treasury stock, at cost (1,837) Additional paid-in capital 33,658 Accumulated other comprehensive loss (986) Retained earnings 31,220 Stockholders' equity 62,060 Total liabilities and stockholders' equity 225,248 Based on 10-K (Filing date: 2020-01-31),10K (iling date: 2019-02-01) 10-K (filing date: 2018-02-02),10-K (Filing date:2 (1,837) (1,837) 26,791 21,389 (1,035) (484) 19,625 8,636 43,549 27,709 162,648 131,310 17.02-10), 10-K (hling date: 2016-01-29). (1,837) 17,186 (985) 4,916 19,285 83,402 (1,837) 13,394 (723) 2,545 13,384 65,444 Amazon.com Inc. Consolidated Balance Sheet: Assets US$ in millions Dec 31, 2019 Cash and cash equivalents 36,092 Marketable securities 18,929 Inventories 20,497 Accounts receivable, net 17,663 Other 3,153 Accounts receivable, net and other 20,816 Current assets 96,334 Property and equipment, net 72,705 Operating leases 25,141 Goodwill 14,754 Other assets 16,314 Long-term assets 128,914 Total assets 225,248 Based on:10-K (filing date: 2020-01-31),10-K (filing date: 2019-02-01),10-K (filing date: 2018-02-02),10 K (filing date:2 Dec 31, 2018 31,750 9,500 17,174 13,310 3,367 16,677 75,101 61,797 Dec 31, 2017 20,522 10,464 16,047 9,692 3,472 13,164 60,197 48,866 Dec 31, 2016 19,334 6,647 11,461 6,561 1,778 8,339 45,781 29,114 Dec 31, 2015 15,890 3,918 10,243 4,400 2,023 6,423 36,474 21,838 14,548 13,350 11,202 8,897 87,547 71,113 162,648 131,310 -02-10),10-K (filing date: 2016-01-29). 3,784 4,723 37,621 83,402 3,759 3,373 28,970 65,444 Amazon.com Inc. Short-term (Operating) Activity Ratios Dec 31, 2019 Dec 31, 2018 Dec 31, 2017 Dec 31, 2016 Dec 31, 2015 Turnover Ratios Inventory turnover Receivables turnover Payables turnover Working capital turnover 8.08 15.88 3.51 32.92 8.10 17.50 3.64 34.71 6.98 18.35 3.23 76.87 7.70 20.73 3.49 69.20 7.00 24.32 3.51 41.56 Average No. Days Average inventory processing period Add: Average receivable collection period Operating cycle Less: Average payables payment period Cash conversion cycle Based on: 10-k (filine date: 2020-01-31),10K (hing date: 2019-02-01),10-K (Filing date: 2018-02-02),10-K (filing date: 2 -34 017-02-10,10-K (hing date: 2016-01-29) C D E F G 2019 124 : X V fx I B Your Company Income Statement For the Year Ended Dec. 31 2019 2019 Sales 5 Cost of Goods Sold Gross Profit Selling and G&A Expenses Fixed Expenses o Depreciation Expense 1 EBIT 2 Interest Expense 3 Earnings Before Taxes 4 Taxes 5 Net Income Your Company Balance Sheet As of Dec. 31 2019 Assets Cash Accounts Receivable Inventories Total Current Assets Gross Fixed Assets Accumulated Depreciation Net Fixed Assets Total Assets Liabilities and Owners' Equity Accounts Payable Short-term Notes Payable Accrued Expenses Total Current Liabilities Long-term Debt Total Liabilities Common Stock Retained Earnings Total Shareholder's Equity Total Liabilities and Owners' Equity 7 Tax Rate LE Your company Comparable Company Analysis 2 Ratios 3 4 Current Ratio 5 Quick Ratio 6 7 Inventory Turnover Ratio 8 Accounts Receivable Turnover Ratio 9 Average Collection Period 10 Fixed Asset Turnover 11 Total Asset Turnover 12 13 Total Debt Ratio 14 Long-Term Debt Ratio 15 LTD to Total Capitalization 16 Debt to Equity 17 Long-Term Debt to Equity 19 Gross Profit Margin 20 Operating Proft Margin 21 Net Proft Margin 22 Return on Total Assets 23 Return on Equity 24 Return on Common Equity Amazon.com Inc. Consolidated Income Statement US$ in millions 12 months ended Dec 31, 2019 Net product sales 160,408 Net services sales 120,114 Net sales 280,522 Cost of sales (165,536) Gross profit 114,986 Fulfillment (40,232) Technology and content (35,931) Marketing (18,878) General and administrative (5,203) Other operating expense, net (201) Operating income 14,541 Interest income 832 Interest expense (1,600) Other income (expense), net 203 Non-operating income (expense) (565) Income before income taxes 13,976 Provision for income taxes (2,374) Equity-method investment activity, net of tax (14) Net income 11,588 Based on 10-K (Filing date: 2020-01-31),10-K filing date: 2019-02-01),10-K (filing date: 2018-02-02), 10-K (filing date: 2 Dec 31, 2018 Dec 31, 2017 141,915 118,573 90,972 59,293 232,887 177,866 (139,156) (111,934) 93,731 65,932 (34,027) (25,249) (28,837) (22,620) (13,814) (10,069) (4,336) (3,674) (296) (214) 12,421 4,106 440 202 (1,417) (848) (183) 346 (1,160) (300) 11,261 3,806 (1,197) (769) (4) 10,073 3,033 017-02-10),10-K (Filing date: 2016-01-29). Dec 31, 2016 94,665 41,322 135,987 (88,265) 47,722 (17,619) (16,085) (7,233) (2,432) (167) 4,186 100 (484) 90 (294) 3,892 (1,425) (96) Dec 31, 2015 79,268 27,738 107,006 (71,651) 35,355 (13,410) (12,540) (5,254) (1,747) (171) 2,233 50 (459) (256) (665) 1,568 (950) (22) 596 2,371 Amazon.com Inc. Consolidated Balance Sheet: Liabilities and Stockholders' Equity US$ in millions Dec 31, 2018 38,192 Dec 31, 2017 34,616 Dec 31, 2016 25,309 Dec 31, 2015 20,397 Accounts payable Current portion of lease liabilities, operating leases Current portion of lease liabilities, finance leases Current portion of long-term debt Other Accrued expenses and other Unearned revenue Current liabilities Dec 31, 2019 47,183 3,139 9,884 1,307 18,109 32,439 8,190 87,812 7,720 1,371 14,572 23,663 6,536 68,391 5,839 100 12,231 18,170 5,097 57,883 3,997 1,056 8,686 13,739 4,768 43,816 3,027 238 7,119 10,384 3,118 33,899 Long-term lease liabilities, operating leases, excluding current portion Long-term lease liabilities, finance leases, excluding current portion Long-term lease liabilities, excluding current portion Long-term debt, excluding current portion Other long-term liabilities Long-term liabilities Total liabilities 22,696 17,095 39,791 23,414 12,171 75,376 163,188 9,650 9,650 23,495 17,563 50,708 119,099 8,438 8,438 24,743 12,537 45,718 103,601 5,080 5,080 7,694 7,527 20,301 64,117 4,212 4,212 8,235 5,714 18,161 52,060 Preferred stock, $0.01 par value; issued and outstanding shares - none Common stock, $0.01 par value Treasury stock, at cost (1,837) Additional paid-in capital 33,658 Accumulated other comprehensive loss (986) Retained earnings 31,220 Stockholders' equity 62,060 Total liabilities and stockholders' equity 225,248 Based on 10-K (Filing date: 2020-01-31),10K (iling date: 2019-02-01) 10-K (filing date: 2018-02-02),10-K (Filing date:2 (1,837) (1,837) 26,791 21,389 (1,035) (484) 19,625 8,636 43,549 27,709 162,648 131,310 17.02-10), 10-K (hling date: 2016-01-29). (1,837) 17,186 (985) 4,916 19,285 83,402 (1,837) 13,394 (723) 2,545 13,384 65,444 Amazon.com Inc. Consolidated Balance Sheet: Assets US$ in millions Dec 31, 2019 Cash and cash equivalents 36,092 Marketable securities 18,929 Inventories 20,497 Accounts receivable, net 17,663 Other 3,153 Accounts receivable, net and other 20,816 Current assets 96,334 Property and equipment, net 72,705 Operating leases 25,141 Goodwill 14,754 Other assets 16,314 Long-term assets 128,914 Total assets 225,248 Based on:10-K (filing date: 2020-01-31),10-K (filing date: 2019-02-01),10-K (filing date: 2018-02-02),10 K (filing date:2 Dec 31, 2018 31,750 9,500 17,174 13,310 3,367 16,677 75,101 61,797 Dec 31, 2017 20,522 10,464 16,047 9,692 3,472 13,164 60,197 48,866 Dec 31, 2016 19,334 6,647 11,461 6,561 1,778 8,339 45,781 29,114 Dec 31, 2015 15,890 3,918 10,243 4,400 2,023 6,423 36,474 21,838 14,548 13,350 11,202 8,897 87,547 71,113 162,648 131,310 -02-10),10-K (filing date: 2016-01-29). 3,784 4,723 37,621 83,402 3,759 3,373 28,970 65,444 Amazon.com Inc. Short-term (Operating) Activity Ratios Dec 31, 2019 Dec 31, 2018 Dec 31, 2017 Dec 31, 2016 Dec 31, 2015 Turnover Ratios Inventory turnover Receivables turnover Payables turnover Working capital turnover 8.08 15.88 3.51 32.92 8.10 17.50 3.64 34.71 6.98 18.35 3.23 76.87 7.70 20.73 3.49 69.20 7.00 24.32 3.51 41.56 Average No. Days Average inventory processing period Add: Average receivable collection period Operating cycle Less: Average payables payment period Cash conversion cycle Based on: 10-k (filine date: 2020-01-31),10K (hing date: 2019-02-01),10-K (Filing date: 2018-02-02),10-K (filing date: 2 -34 017-02-10,10-K (hing date: 2016-01-29) C D E F G 2019 124 : X V fx I B Your Company Income Statement For the Year Ended Dec. 31 2019 2019 Sales 5 Cost of Goods Sold Gross Profit Selling and G&A Expenses Fixed Expenses o Depreciation Expense 1 EBIT 2 Interest Expense 3 Earnings Before Taxes 4 Taxes 5 Net Income Your Company Balance Sheet As of Dec. 31 2019 Assets Cash Accounts Receivable Inventories Total Current Assets Gross Fixed Assets Accumulated Depreciation Net Fixed Assets Total Assets Liabilities and Owners' Equity Accounts Payable Short-term Notes Payable Accrued Expenses Total Current Liabilities Long-term Debt Total Liabilities Common Stock Retained Earnings Total Shareholder's Equity Total Liabilities and Owners' Equity 7 Tax Rate LE Your company Comparable Company Analysis 2 Ratios 3 4 Current Ratio 5 Quick Ratio 6 7 Inventory Turnover Ratio 8 Accounts Receivable Turnover Ratio 9 Average Collection Period 10 Fixed Asset Turnover 11 Total Asset Turnover 12 13 Total Debt Ratio 14 Long-Term Debt Ratio 15 LTD to Total Capitalization 16 Debt to Equity 17 Long-Term Debt to Equity 19 Gross Profit Margin 20 Operating Proft Margin 21 Net Proft Margin 22 Return on Total Assets 23 Return on Equity 24 Return on Common Equity
Step by Step Solution
There are 3 Steps involved in it
1 Expert Approved Answer
Step: 1 Unlock

Question Has Been Solved by an Expert!
Get step-by-step solutions from verified subject matter experts
Step: 2 Unlock
Step: 3 Unlock