

Question: a) Compute a linear trend line for freight car loadings using of Excel's Trendline, with display Equation on chart option. b) Use the trend equation
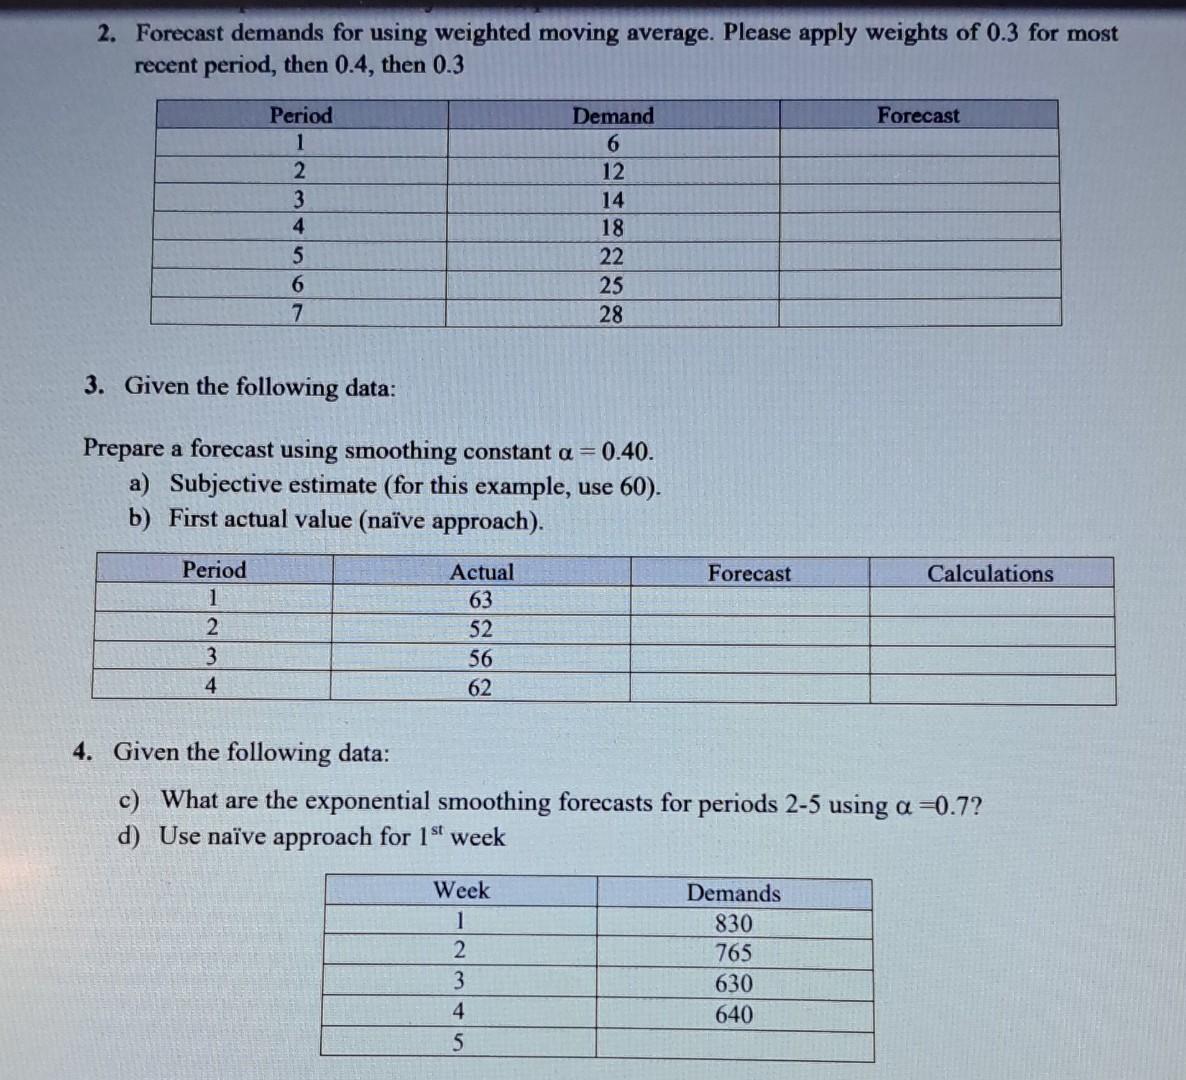
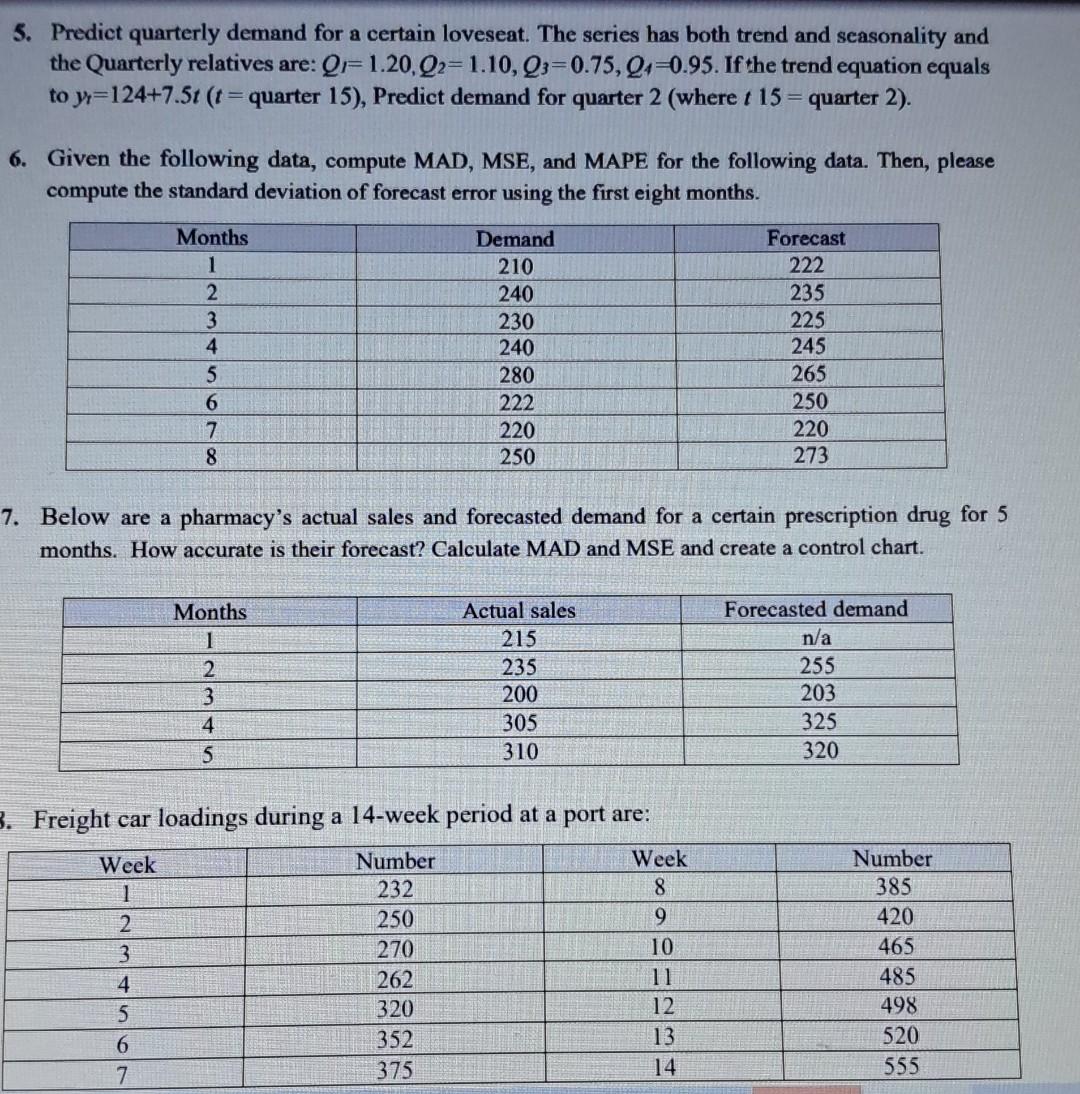
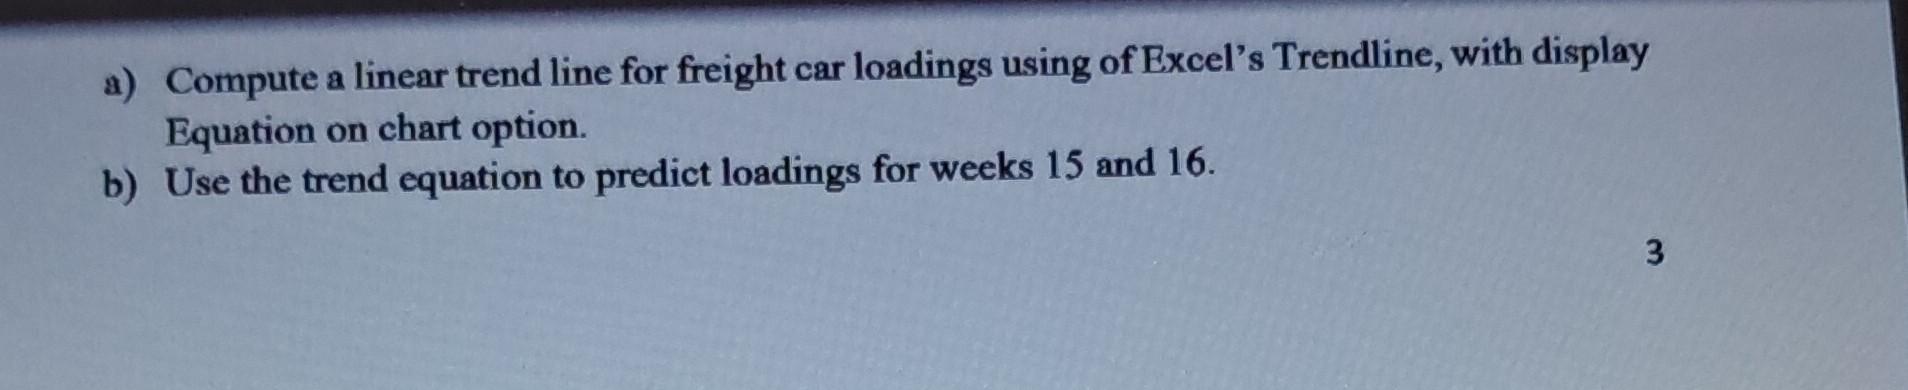
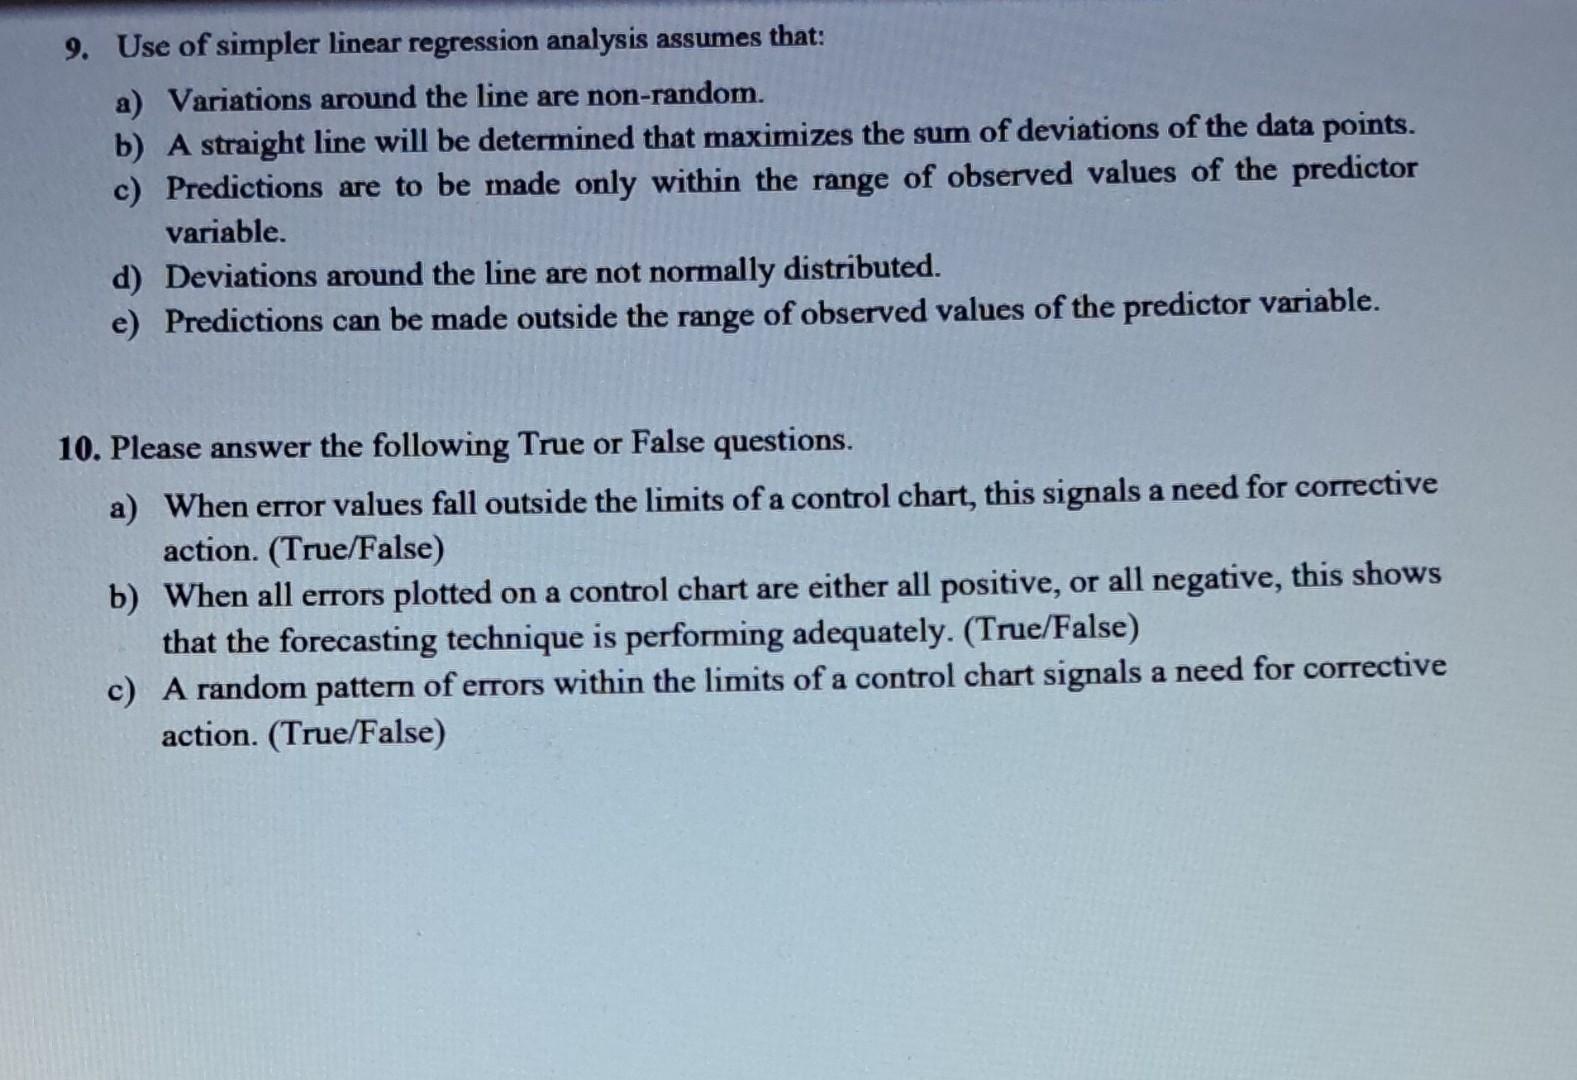
a) Compute a linear trend line for freight car loadings using of Excel's Trendline, with display Equation on chart option. b) Use the trend equation to predict loadings for weeks 15 and 16. 2. Forecast demands for using weighted moving average. Please apply weights of 0.3 for most recent period, then 0.4 , then 0.3 3. Given the following data: Prepare a forecast using smoothing constant =0.40. a) Subjective estimate (for this example, use 60 ). b) First actual value (nave approach). 4. Given the following data: c) What are the exponential smoothing forecasts for periods 25 using =0.7 ? d) Use nave approach for 1st week 5. Predict quarterly demand for a certain loveseat. The series has both trend and seasonality and the Quarterly relatives are: QI=1.20,Q2=1.10,Q3=0.75,Q4=0.95. If the trend equation equals to yt=124+7.5t(t= quarter 15), Predict demand for quarter 2 (where t15= quarter 2 ). 6. Given the following data, compute MAD, MSE, and MAPE for the following data. Then, please compute the standard deviation of forecast error using the first eight months. 7. Below are a pharmacy's actual sales and forecasted demand for a certain prescription drug for 5 months. How accurate is their forecast? Calculate MAD and MSE and create a control chart. Freight car loadings during a 14-week period at a port are: 9. Use of simpler linear regression analysis assumes that: a) Variations around the line are non-random. b) A straight line will be determined that maximizes the sum of deviations of the data points. c) Predictions are to be made only within the range of observed values of the predictor variable. d) Deviations around the line are not normally distributed. e) Predictions can be made outside the range of observed values of the predictor variable. 10. Please answer the following True or False questions. a) When error values fall outside the limits of a control chart, this signals a need for corrective action. (True/False) b) When all errors plotted on a control chart are either all positive, or all negative, this shows that the forecasting technique is performing adequately. (True/False) c) A random pattern of errors within the limits of a control chart signals a need for corrective action. (True/False)
Step by Step Solution
There are 3 Steps involved in it

Get step-by-step solutions from verified subject matter experts