

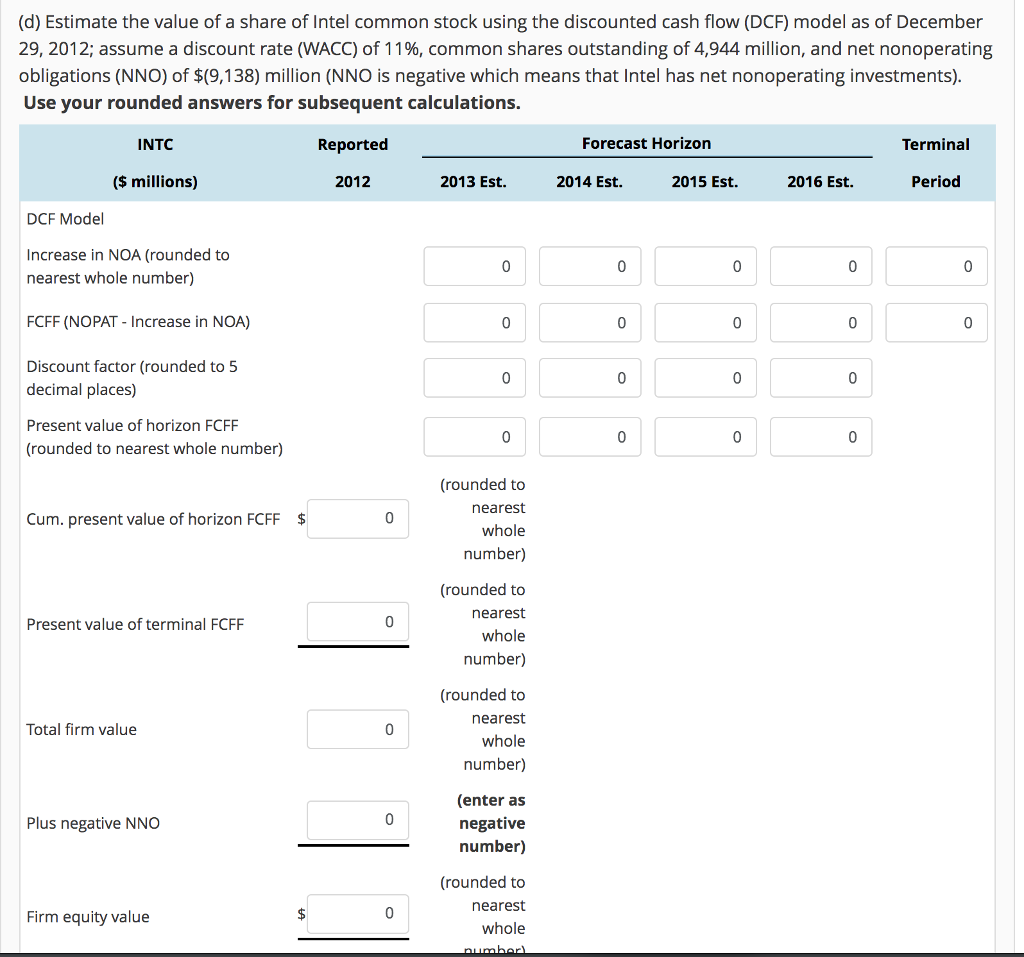
Question: (a) Compute Intel's net operating assets (NOA) for year-end 2012. 2012 NOA = $Answer (b) Compute net operating profit after tax (NOPAT) for 2012, assuming
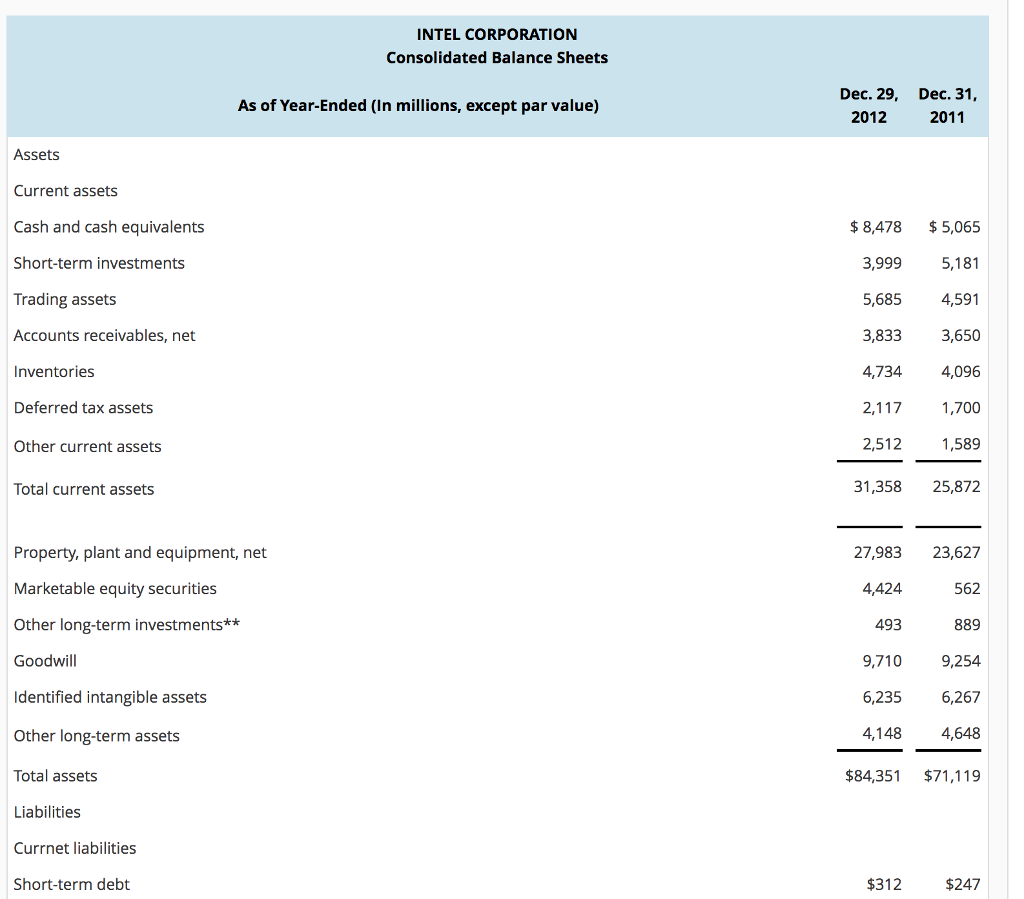
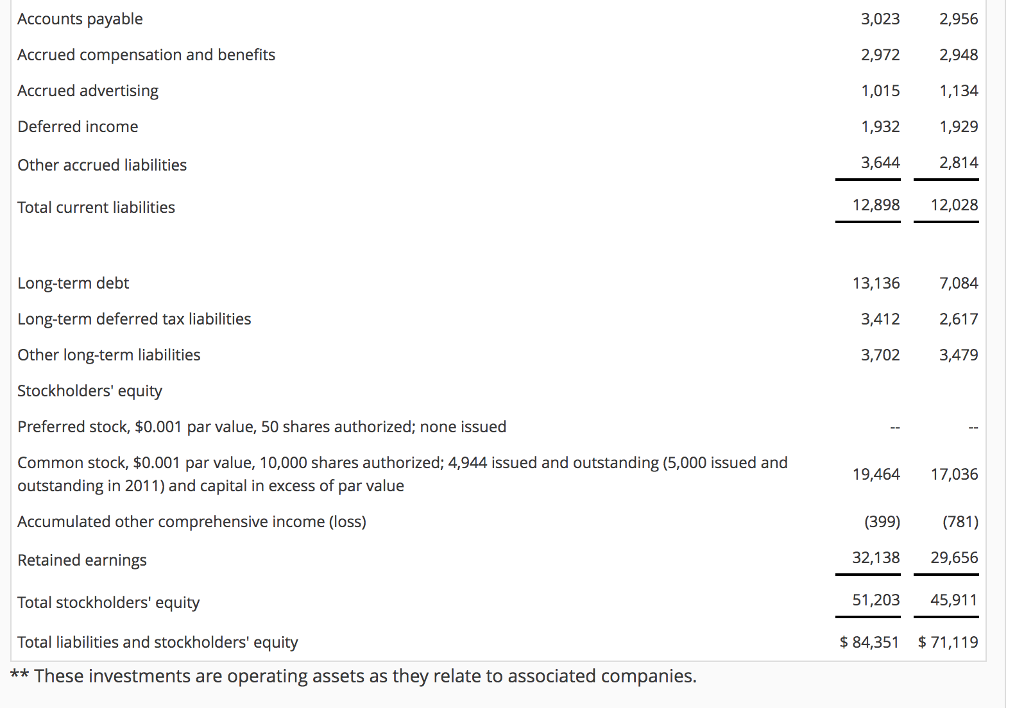
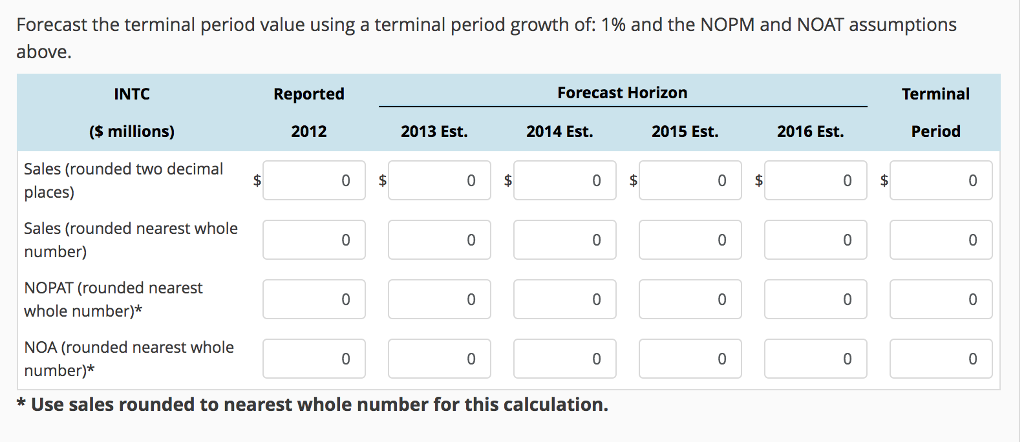
(a) Compute Intel's net operating assets (NOA) for year-end 2012. 2012 NOA = $Answer (b) Compute net operating profit after tax (NOPAT) for 2012, assuming a federal and state tax rate of 37%.(Round your answer to the nearest whole number.) 2012 NOPAT = $Answer (c) Forecast Intel's sales, NOPAT, and NOA for years 2013 through 2016 using the following assumptions:
| Sales growth | 10% |
| Net operating profit margin (NOPM) | 20.4% |
| Net operating asset turnover (NOAT) at year-end 1.27
|
|
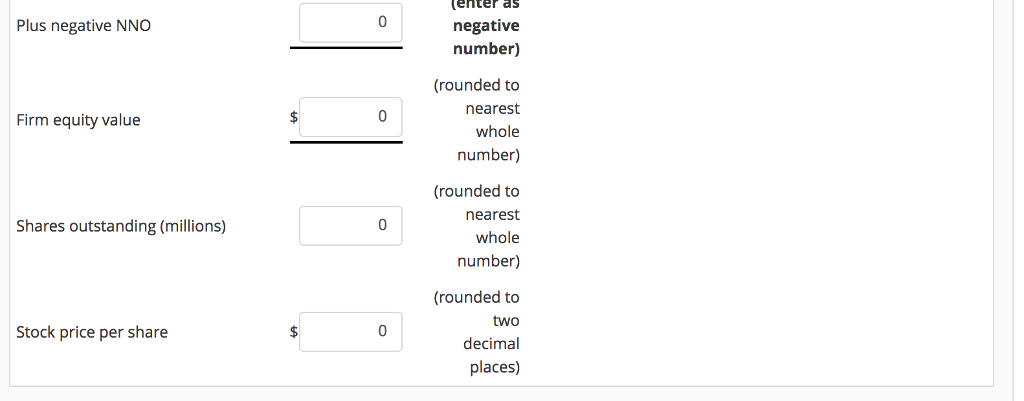
(e) Intel (INTC) stock closed at $21.09 on February 19, 2013, the date the Form 10-K was filed with the SEC. How does your valuation estimate compare with this closing price? What do you believe are some reasons for the difference? What investment decision is suggested from your results? (Select all that apply) Answeryesno Our stock price estimate is higher than the INTC market price as of February 19, 2013, indicating that we believe the stock is undervalued. Answeryesno Stock prices are a function of expected NOPAT and NOA, as well as the WACC discount rate. Answeryesno Our lower stock price estimate may be due to more pessimistic forecasts or a higher discount rate compared to other investors' and analysts model assumptions. Answeryesno Our higher stock price estimate may be due to more optimistic forecasts or a lower discount rate compared to other investors' and analysts model assumptions.
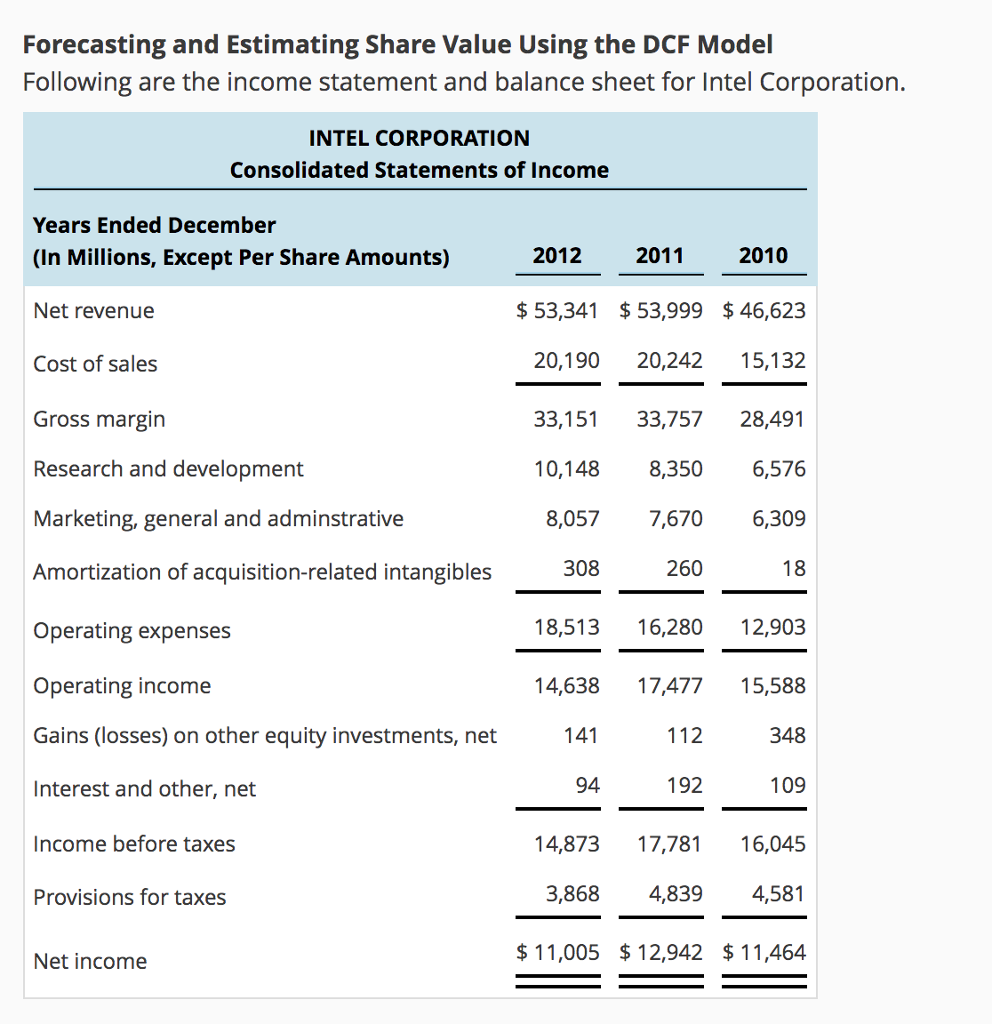
Forecasting and Estimating Share Value Using the DCF Model Following are the income statement and balance sheet for Intel Corporation INTEL CORPORATION Consolidated Statements of Income Years Ended December 2012 2011 2010 (In Millions, Except Per Share Amounts) 53,341 53,999 46,623 Net revenue 20,190 20,242 15,132 Cost of sales 33,151 33,757 28,491 Gross margin Research and development 10,148 8,350 6,576 Marketing, general and adminstrative 8,057 7,670 6,309 260 308 18 Amortization of acquisition-related intangibles 18,513 16,280 12,903 Operating expenses Operating income 14,638 17,477 15,588 Gains (losses) on other equity investments, net 141 348 112 192 94 109 Interest and other, net 14,873 171781 16,045 Income before taxes 3,868 4,839 4,581 Provisions for taxes 11,005 12,942 11,464 Net income
Step by Step Solution
There are 3 Steps involved in it

Get step-by-step solutions from verified subject matter experts