

Question: Estimating Share Value Using the ROPI Model Assume the following are the income statement and balance sheet for Intel Corporation. (a) Compute Intel's net operating
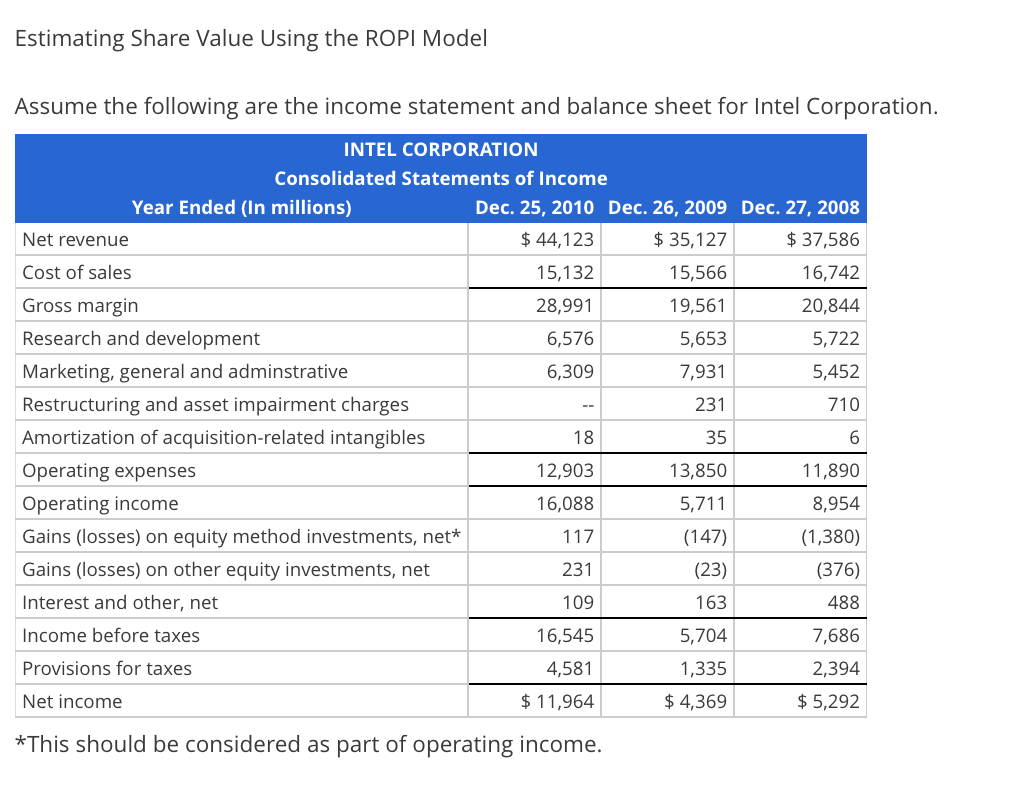
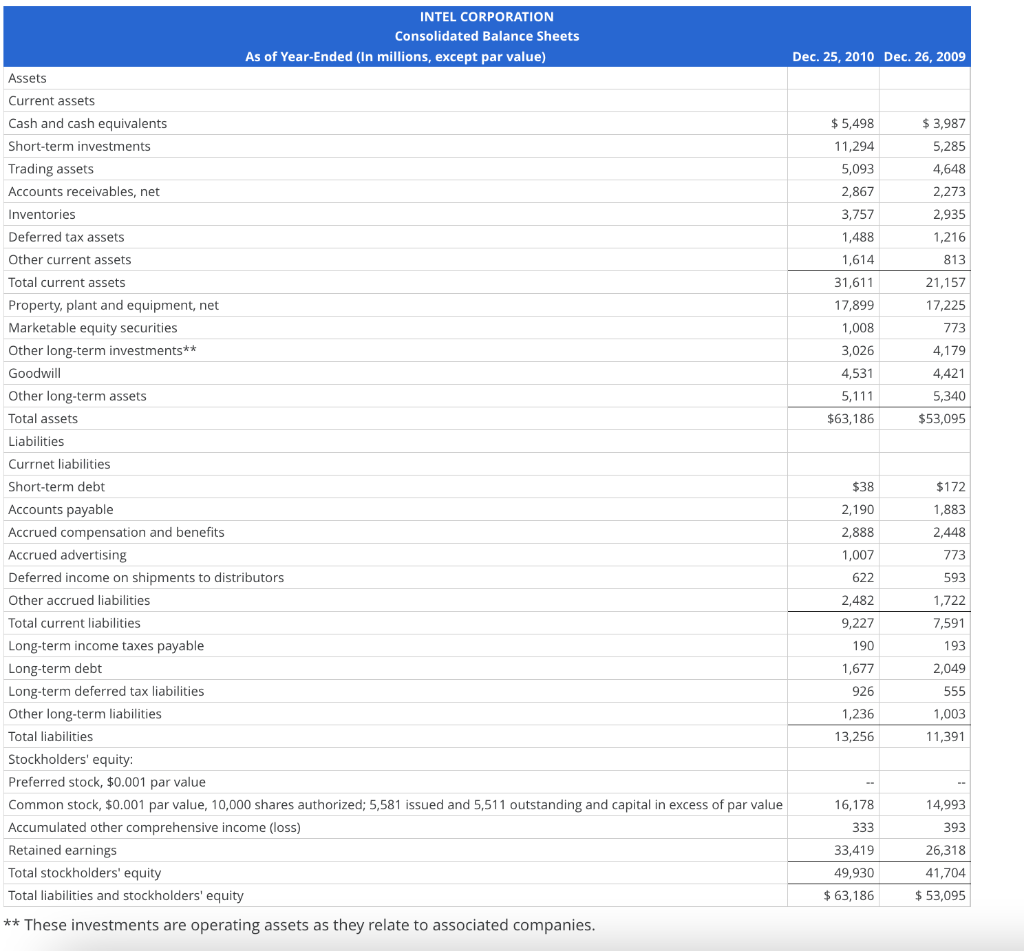
 Estimating Share Value Using the ROPI Model Assume the following are the income statement and balance sheet for Intel Corporation.
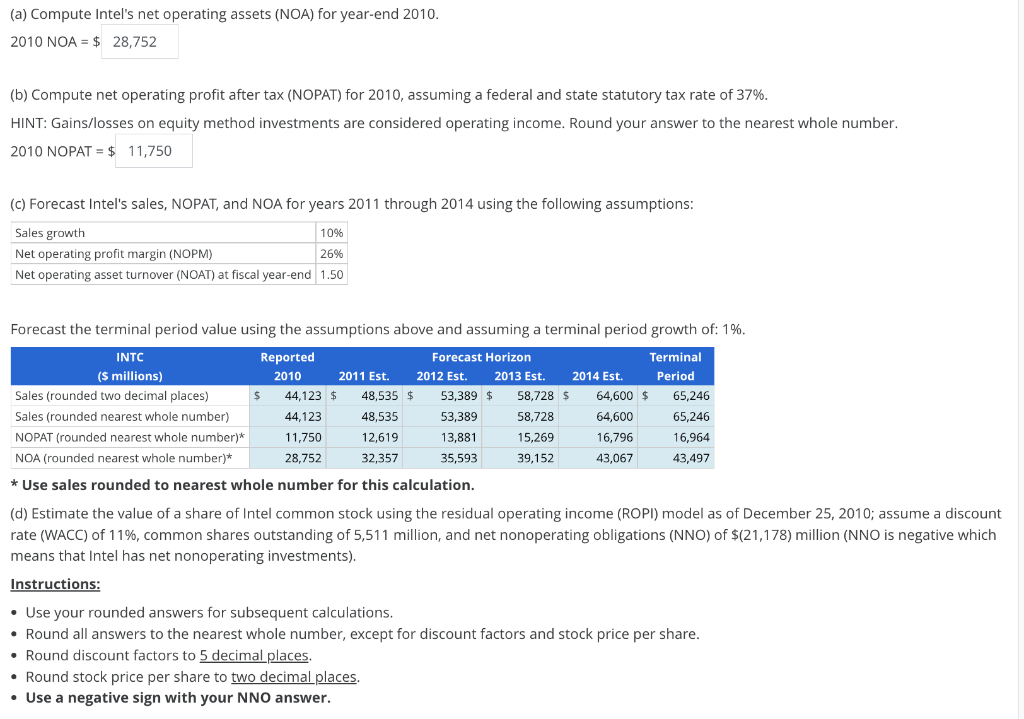
(a) Compute Intel's net operating assets (NOA) for year-end 2010. 2010 NOA = $Answer
(b) Compute net operating profit after tax (NOPAT) for 2010, assuming a federal and state statutory tax rate of 37%.
HINT: Gains/losses on equity method investments are considered operating income. Round your answer to the nearest whole number. 2010 NOPAT = $
(c) Forecast Intel's sales, NOPAT, and NOA for years 2011 through 2014 using the following assumptions:
| Sales growth | 10% |
| Net operating profit margin (NOPM) | 26% |
| Net operating asset turnover (NOAT) at fiscal year-end | 1.50 |
(d) Estimate the value of a share of Intel common stock using the residual operating income (ROPI) model as of December 25, 2010; assume a discount rate (WACC) of 11%, common shares outstanding of 5,511 million, and net nonoperating obligations (NNO) of $(21,178) million (NNO is negative which means that Intel has net nonoperating investments).
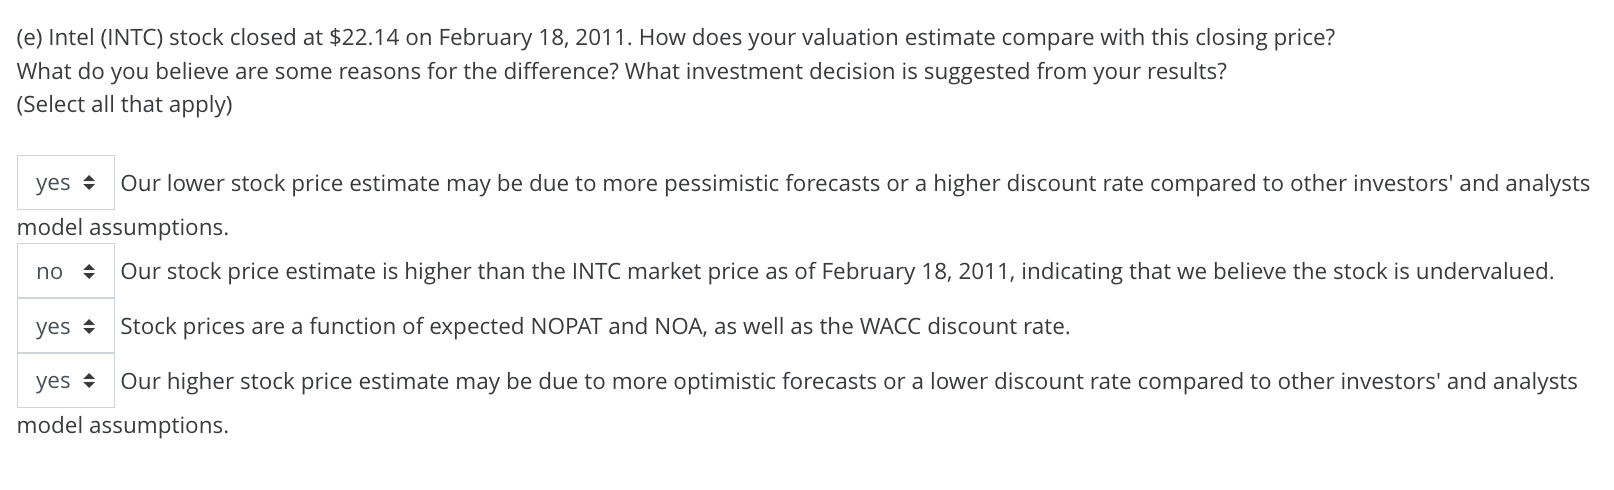
(e) Intel (INTC) stock closed at $22.14 on February 18, 2011. How does your valuation estimate compare with this closing price? What do you believe are some reasons for the difference? What investment decision is suggested from your results? (Select all that apply) Answeryesno Our lower stock price estimate may be due to more pessimistic forecasts or a higher discount rate compared to other investors' and analysts model assumptions. Answeryesno Our stock price estimate is higher than the INTC market price as of February 18, 2011, indicating that we believe the stock is undervalued. Answeryesno Stock prices are a function of expected NOPAT and NOA, as well as the WACC discount rate. Answeryesno Our higher stock price estimate may be due to more optimistic forecasts or a lower discount rate compared to other investors' and analysts model assumptions.
Estimating Share Value Using the ROPI Model Assume the following are the income statement and balance sheet for Intel Corporation. INTEL CORPORATION Consolidated Statements of Income Year Ended (In millions) Dec. 25, 2010 Dec. 26, 2009 Dec. 27, 2008 Net revenue $ 44,123 $ 35,127 $ 37,586 Cost of sales 15,132 15,566 16,742 Gross margin 28,991 19,561 20,844 Research and development 6,576 5,653 5,722 Marketing, general and adminstrative 6,309 7,931 5,452 Restructuring and asset impairment charges 231 710 Amortization of acquisition-related intangibles 18 35 6 Operating expenses 12,903 13,850 11,890 Operating income 16,088 5,711 8,954 Gains (losses) on equity method investments, net* 117 (147) (1,380) Gains (losses) on other equity investments, net 231 (23) (376) Interest and other, net 109 163 488 Income before taxes 16,545 5,704 7,686 Provisions for taxes 4,581 1,335 2,394 Net income $ 11,964 $ 4,369 $ 5,292 *This should be considered as part of operating income. INTEL CORPORATION Consolidated Balance Sheets As of Year-Ended (In millions, except par value) Dec. 25, 2010 Dec. 26, 2009 Assets $ 3,987 5,285 $ 5,498 11,294 5,093 2,867 4,648 2,273 3,757 1,488 1,614 31,611 17,899 2,935 1,216 813 21,157 1,008 3,026 17,225 773 4,179 4,531 5,111 4,421 5,340 $63,186 $53,095 $172 Current assets Cash and cash equivalents Short-term investments Trading assets Accounts receivables, net Inventories Deferred tax assets Other current assets Total current assets Property, plant and equipment, net Marketable equity securities Other long-term investments** Goodwill Other long-term assets Total assets Liabilities Currnet liabilities Short-term debt Accounts payable Accrued compensation and benefits Accrued advertising Deferred income on shipments to distributors Other accrued liabilities Total current liabilities Long-term income taxes payable Long-term debt Long-term deferred tax liabilities Other long-term liabilities Total liabilities Stockholders' equity: Preferred stock, $0.001 par value Common stock, $0.001 par value, 10,000 shares authorized; 5,581 issued and 5,511 outstanding and capital in excess of par value Accumulated other comprehensive income (loss) Retained earnings Total stockholders' equity Total liabilities and stockholders' equity $38 2,190 2,888 1,007 622 2,482 9,227 1,883 2,448 773 593 1,722 190 1,677 926 1,236 13,256 7,591 193 2,049 555 1,003 11,391 14,993 16,178 333 33,419 49,930 $ 63,186 393 26,318 41,704 $ 53,095 ** These investments are operating assets as they relate to associated companies. (a) Compute Intel's net operating assets (NOA) for year-end 2010. 2010 NOA = $ 28,752 (b) Compute net operating profit after tax (NOPAT) for 2010, assuming a federal and state statutory tax rate of 37%. HINT: Gains/losses on equity method investments are considered operating income. Round your answer to the nearest whole number. 2010 NOPAT = $ 11,750 (C) Forecast Intel's sales, NOPAT, and NOA for years 2011 through 2014 using the following assumptions: Sales growth 10% Net operating profit margin (NOPM) 26% Net operating asset turnover (NOAT) at fiscal year-end 1.50 Forecast the terminal period value using the assumptions above and assuming a terminal period growth of: 1%. INTC Reported Forecast Horizon Terminal ($ millions) 2010 2011 Est. 2012 Est. 2013 Est. 2014 Est. Period Sales (rounded two decimal places) 44,123 $ 48,535 $ 53,389 $ 58,728 $ 64,600 $ 65,246 Sales (rounded nearest whole number) 44,123 48,535 53,389 58,728 64,600 65,246 NOPAT (rounded nearest whole number)* 11,750 12,619 13,881 15,269 16,796 16,964 NOA (rounded nearest whole number)* 28,752 32,357 35,593 39,152 43,067 43,497 * Use sales rounded to nearest whole number for this calculation. (d) Estimate the value of a share of Intel common stock using the residual operating income (ROPI) model as of December 25, 2010; assume a discount rate (WACC) of 11%, common shares outstanding of 5,511 million, and net nonoperating obligations (NNO) of $(21,178) million (NNO is negative which means that Intel has net nonoperating investments). Instructions: Use your rounded answers for subsequent calculations. Round all answers to the nearest whole number, except for discount factors and stock price per share. Round discount factors to 5 decimal places. Round stock price per share to two decimal places. Use a negative sign with your NNO answer. (e) Intel (INTC) stock closed at $22.14 on February 18, 2011. How does your valuation estimate compare with this closing price? What do you believe are some reasons for the difference? What investment decision is suggested from your results? (Select all that apply) Yes - Our lower stock price estimate may be due to more pessimistic forecasts or a higher discount rate compared to other investors' and analysts model assumptions. Our stock price estimate is higher than the INTC market price as of February 18, 2011, indicating that we believe the stock is undervalued. no yes - Stock prices are a function of expected NOPAT and NOA, as well as the WACC discount rate. yes Our higher stock price estimate may be due to more optimistic forecasts or a lower discount rate compared to other investors' and analysts model assumptions
Step by Step Solution
There are 3 Steps involved in it

Get step-by-step solutions from verified subject matter experts