

Question: A. compute MAPE for each data set. Which forecast appears to be more accurate? Explain. 21. Two different forecasting techniques (FI and F2) were used
A. compute MAPE for each data set. Which forecast appears to be more accurate? Explain. 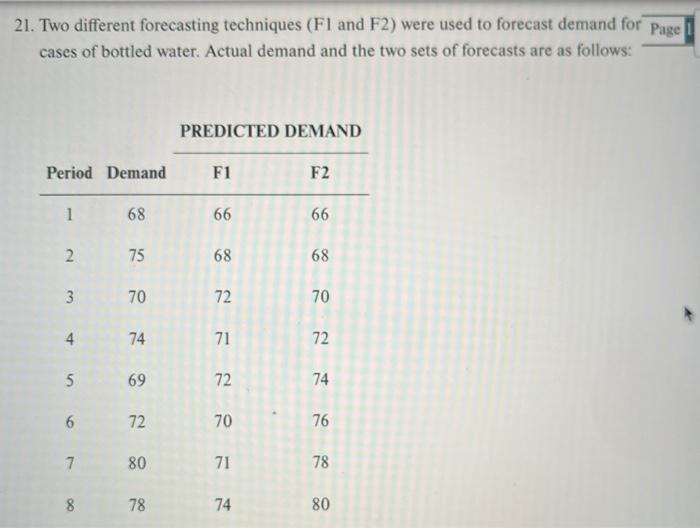
21. Two different forecasting techniques (FI and F2) were used to forecast demand for Page cases of bottled water. Actual demand and the two sets of forecasts are as follows: PREDICTED DEMAND Period Demand F1 F2 1 68 66 66 2 75 68 68 3 70 72 70 4 74 71 72 5 69 72 74 6 72 70 76 7 80 71 78 00 8 78 74 80
Step by Step Solution
There are 3 Steps involved in it
1 Expert Approved Answer
Step: 1 Unlock

Question Has Been Solved by an Expert!
Get step-by-step solutions from verified subject matter experts
Step: 2 Unlock
Step: 3 Unlock