

Question: a. Compute the centered moving average values (first find Four-Quarter Moving Average) for this time series (to 3 decima Centered Moving t Sales 1
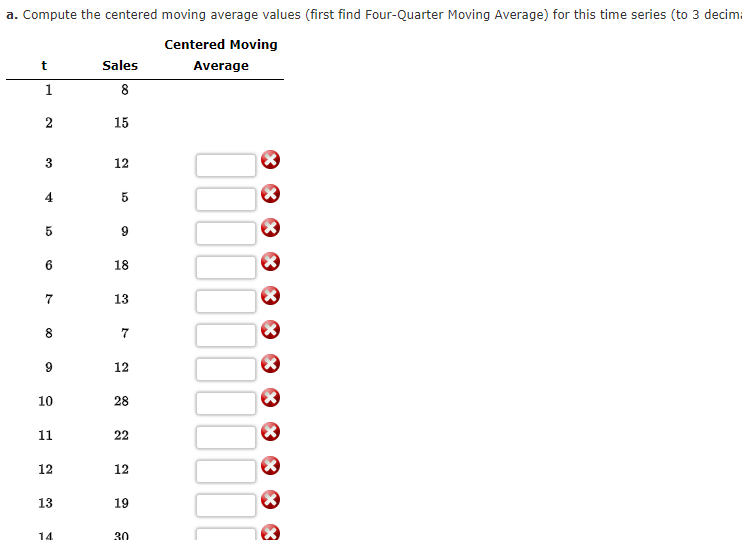
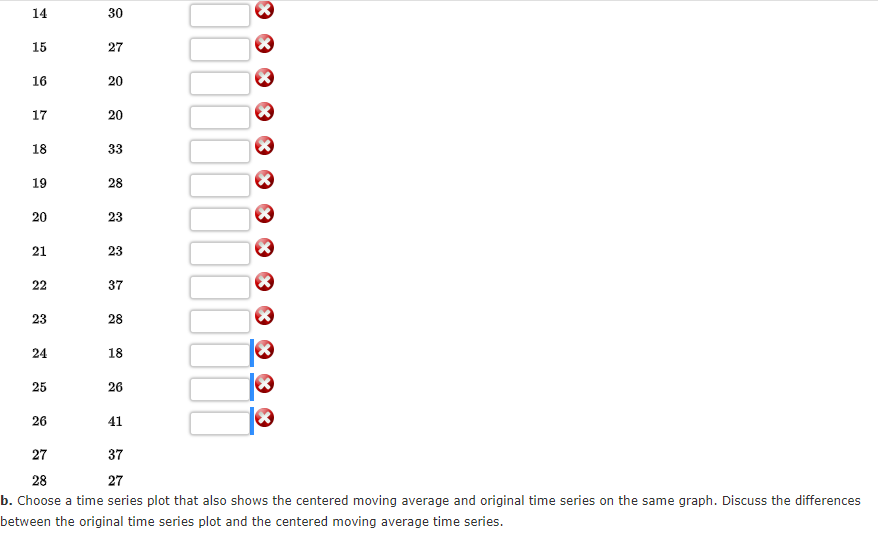
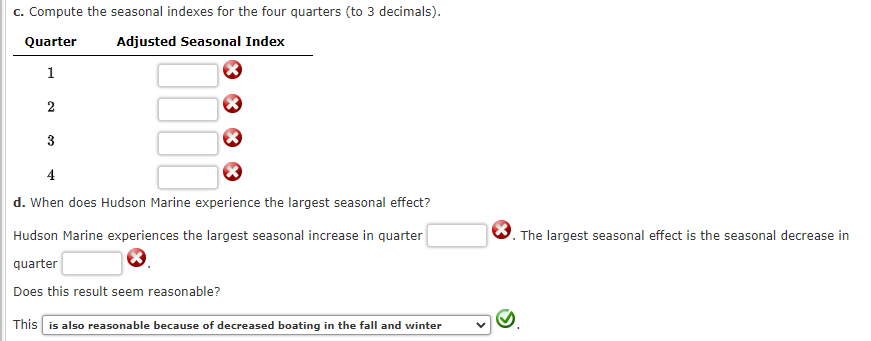
a. Compute the centered moving average values (first find Four-Quarter Moving Average) for this time series (to 3 decima Centered Moving t Sales 1 8 2 15 3 12 4 5 10 5 9 6 18 7 13 8 7 6 12 10 10 28 11 22 12 12 13 19 14 30 Average 14 30 15 27 16 NNN 20 17 20 18 33 19 28 20 20 21 223 22 23 23 37 23 23 28 24 18 25 26 26 41 b. Choose a time series plot that also shows the centered moving average and original time series on the same graph. Discuss the differences between the original time series plot and the centered moving average time series. 27 37 28 27 c. Compute the seasonal indexes for the four quarters (to 3 decimals). Quarter Adjusted Seasonal Index 1 2 3 4 d. When does Hudson Marine experience the largest seasonal effect? Hudson Marine experiences the largest seasonal increase in quarter quarter Does this result seem reasonable? This is also reasonable because of decreased boating in the fall and winter The largest seasonal effect is the seasonal decrease in
Step by Step Solution
There are 3 Steps involved in it

Get step-by-step solutions from verified subject matter experts