

Question: Please help with these two: Thank you! For #1, only help with the ones in RED. For #2 help with everything. 1- South Shore Construction
Please help with these two: Thank you!
For #1, only help with the ones in RED. For #2 help with everything.
1-
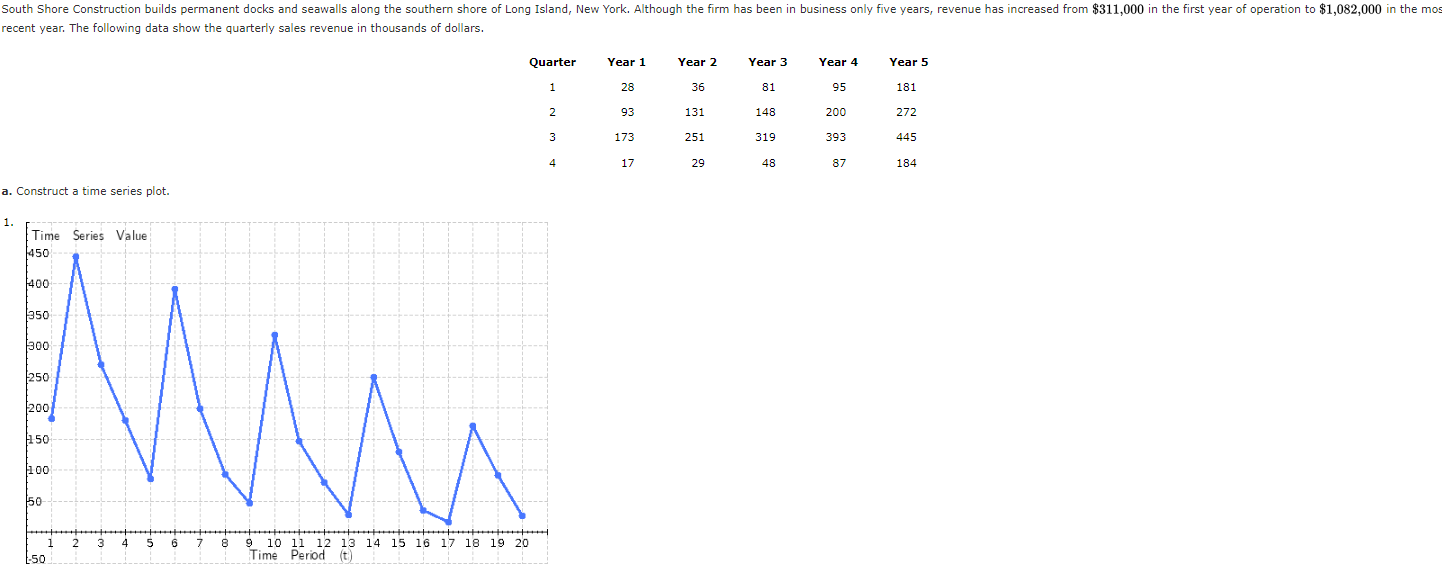
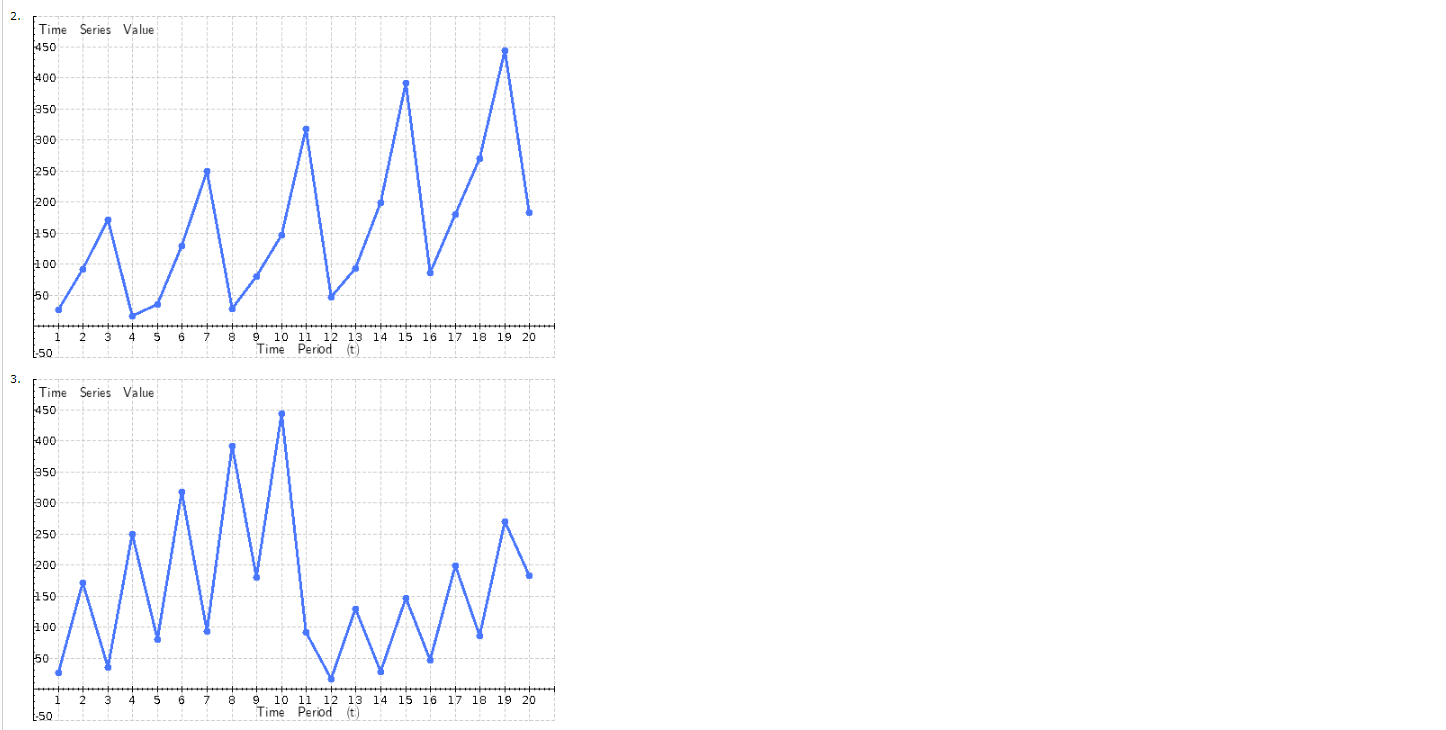
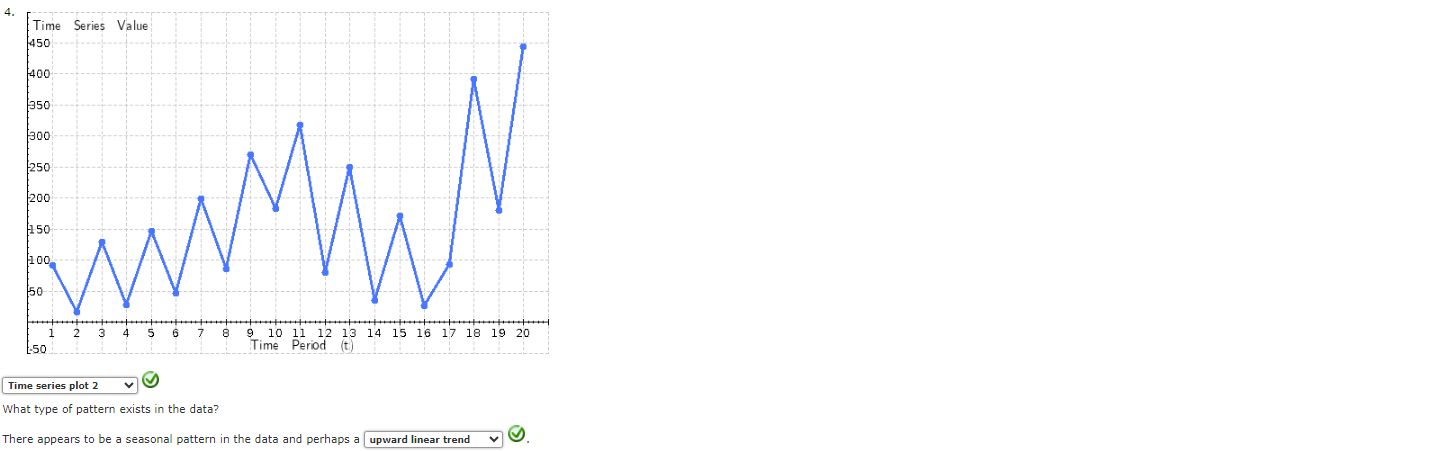


South Shore Construction builds permanent docks and seawalls along the southern shore of Long Island, New York. Although the firm has been in business only five years, revenue has increased from $311,000 in the first year of operation to $1,082,000 in the mo recent year. The following data show the quarterly sales revenue in thousands of dollars. Quarter Year 1 Year 2 Year 3 Year 4 Year 5 1 28 36 81 95 181 N 93 131 148 200 272 173 251 319 393 145 17 29 48 87 184 a. Construct a time series plot. 1. Time Series Value 450 400 350 1300 250 200 150 100 MAS 50 2 3 4 5 6 7 8 9 10 11 12 13 14 15 16 17 18 19 20 -50 Time Period (t2. Time Series Value 450 1400 350 1300 250 200 150 MM 100 50 2 8 9 10 11 12 13 14 15 16 17 18 19 20 -50 Time Period (t) 3. Time Series Value 450 400 350 1300 250 150 100 50 2 3 4 5 6 7 8 9 10 11 12 13 14 15 16 17 18 19 20 -50 Time Period (t)4. e Series Value 450 400 350 300 250 200 150 2 3 5 6 7 8 9 10 11 12 13 14 15 16 17 18 19 20 -50 Time Period (t) Time series plot 2 What type of pattern exists in the data? There appears to be a seasonal pattern in the data and perhaps a |upward linear trendb. Use the following dummy variables to develop an estimated regression equation to acoount for any seasonal effects in the data: Qtrl = 1 if Quarter 1, () otherwise; Qtr2 = 1 if Quarter 2, 0 otherwise; Qtr3 = 1 if Quarter 3, 0 otherwise. Round your answers ( thousands of dollars) to whole number. Revenue = 70 @4 100 Do+ 105D quz + 245 & Qi3 Based only on the seasonal effects in the data, compute estimates of guarterly sales for year 6. Round your answers to whole number Quarter 1 forecast = 227 0 thousands Quarter 2 forecast 322 0 thousands Quarter 3 forecast 463 Q theusands Quarter 4 forecast 218 olhcusands c. Let Period = 1 to refer to the observation in quarter 1 of year 1; Period = 2 to refer to the observation in quarter 2 of vear 1; . . . and Period = 20 to refer to the observation in quarter 4 of year 3. Using the dummy variables defined in part (b) and Period, develop an estimated regression equation to account for seasonal effects and any linear trend in the time series. Round your answers (in thousands of dollars) to whole number. Enter negative value as negative number. The regression equation is: - - - Revenue = 70/ & 4 as D a1+ 128 Dauz + 257 D ous+ 12| & Period Based upon the seasonal effects in the data and linear trend, compute estimates of quarterly sales for year 6. Round your answers to whole number. Quarter 1 forecast = 40 0 thousands Quarter 2 forecast 44 0 thousands Quarter 3 forecast 49 0 thousands Quarter 4 forecast -67 0 thousands Hudson Marine provides boats sales, service, and maintenance. Boat trailers are one of its top sales items. Suppose the quarterly sales values for the seven years of historical data are as follows. Do not round intermediate calculations. Total Yearly Year Quarter 1 Quarter 2 Quarter 3 Quarter 4 Sales 1 8 17 % 2 34 2z 12 17 13 9 51 3 13 24 24 10 71 4 19 25 25 16 B85 5 20 33 27 13 95 & 26 38 31 22 117 7 29 3% 35 25 128 a. Compute the centered moving average values (first find Four-Quarter Moving Average) for this time series (to 3 decimals). Centered Moving t Sales Average 1 6 2 17 3 9 4 2 5 12 6 17 7 13 & 9 9 13 10 24 11 24 12 10 13 19 14 29 15 25 16 16 17 20 18 33 19 27 20 19 21 26 22 38 23 31 24 22 25 29 26 39 27 35 28 25 b. Choose a time series plot that also shows the centered moving average and original time series on the same graph. Discuss the differences between the original time series plot and the centered moving average time series. Sales 5 1o 15 20 25 Year M Sales ECMA Sales S 1 15 20 25 Year M Sales WCMA Sales 5 1o 15 20 25 Year M Sales ECMA 5 1o 15 20 25 Year W Sales ECMA elect your answer - v | The centered moving average values | - Select your answer - v . Compute the seasonal indexes for the four quarters (to 3 decimals). Quarter Adjusted Seasonal Index w e = 4 d. When does Hudson Marine experience the largest seasonal effect? Hudsen Marine expenences the largest seasonal increase in quarter . The largest seasonal effect is the seasonal decrease in quarter Does this result seem reasonable? This | - Select your answer - v
Step by Step Solution
There are 3 Steps involved in it

Get step-by-step solutions from verified subject matter experts