

Question: a. Compute the MSE and MAD for each forecast. (Round your answers to 2 decimal places.) b. Compute MAPE for each forecast. (Round your intermediate
 a. Compute the MSE and MAD for each forecast. (Round your answers to 2 decimal places.)
b. Compute MAPE for each forecast. (Round your intermediate calculations to 5 decimal places and final answers to 4 decimal places.)
c. Prepare a naive forecast for periods 2 through 11 using the given sales data. Compute each of the following; (1) MSE, (2) MAD, (3) tracking signal at month 10, and (4) 2s control limits. (Round your answers to 2 decimal places.)
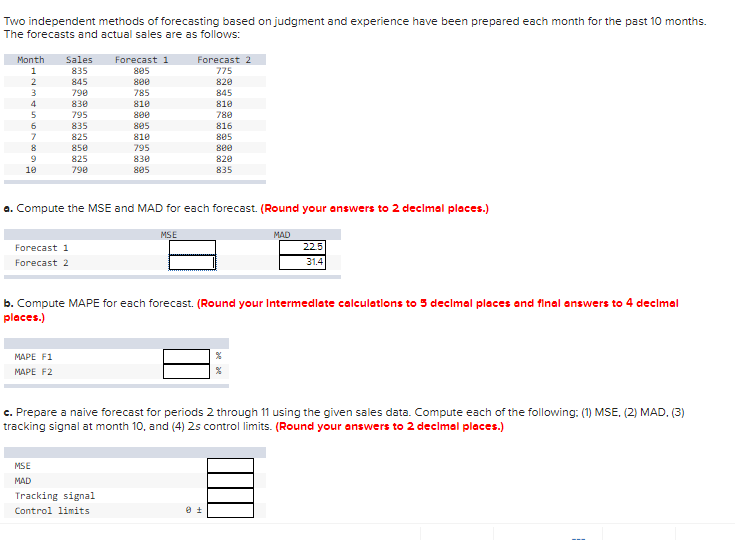
Two independent methods of forecasting based on judgment and experience have been prepared each month for the past 10 months. The forecasts and actual sales are as follows: Forecast 1 895 800 Forecast 2 775 820 845 785 81e Month 1 2 3 4 5 6 7 8 9 10 Sales 835 845 790 830 795 835 825 850 825 790 800 895 810 795 830 895 810 780 816 805 880 820 835 a. Compute the MSE and MAD for each forecast. (Round your answers to 2 decimal places.) MSE MAD Forecast 1 Forecast 2 22.5 31.4 b. Compute MAPE for each forecast. (Round your Intermedlete calculations to 5 declmal places and final answers to 4 declmal places.) MAPE F1 MAPE F2 c. Prepare a naive forecast for periods 2 through 11 using the given sales data. Compute each of the following: (1) MSE, (2) MAD. (3) tracking signal at month 10, and (4) 2s control limits. (Round your answers to 2 decimal places.) MSE MAD Tracking signal Control limitsStep by Step Solution
There are 3 Steps involved in it
1 Expert Approved Answer
Step: 1 Unlock

Question Has Been Solved by an Expert!
Get step-by-step solutions from verified subject matter experts
Step: 2 Unlock
Step: 3 Unlock