

Question: A. Consider a system with two servers in parallel who serve customers from a single line. Customers are served in a First-Come First-Served fashion. If
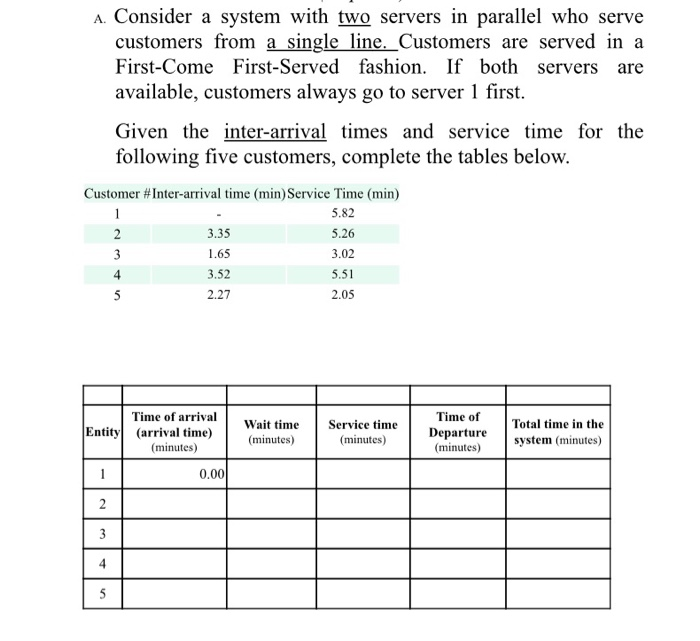
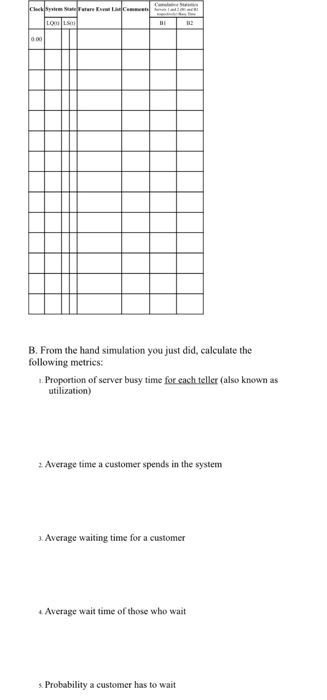
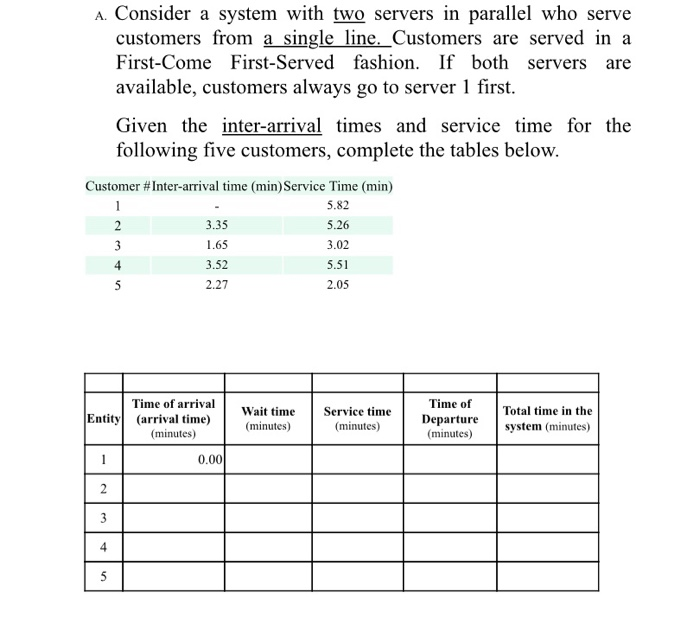
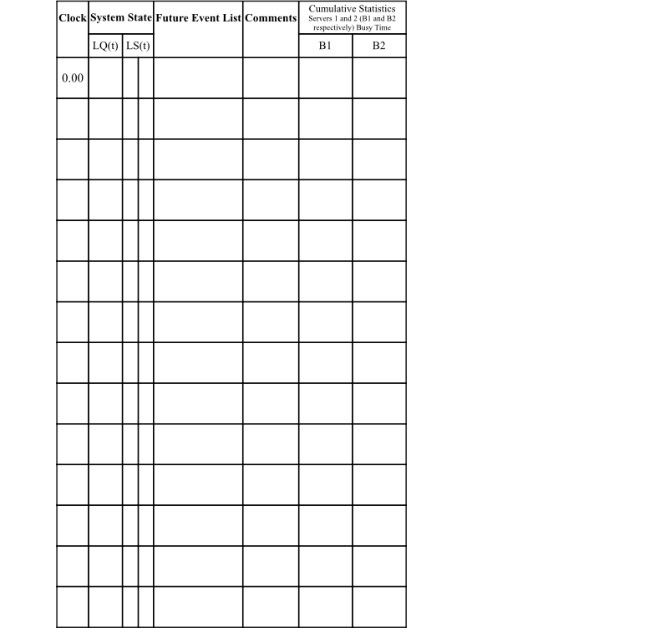
A. Consider a system with two servers in parallel who serve customers from a single line. Customers are served in a First-Come First-Served fashion. If both servers are available, customers always go to server 1 first. Given the inter-arrival times and service time for the following five customers, complete the tables below. Customer #Inter-arrival time (min) Service Time (min) 5.82 2 3.35 5.26 3 1.65 3.02 4 3.52 5.51 5 2.27 2.05 Time of arrival Entity (arrival time) (minutes) Wait time (minutes) Service time (minutes) Time of Departure (minutes) Total time in the system (minutes) 0.00 2 3 4 5 Chrisuaire Man LO. 000 B. From the hand simulation you just did, calculate the following metrics: 1. Proportion of server busy time for each teller (also known as utilization) 2. Average time a customer spends in the system 3. Average waiting time for a customer Average wait time of those who wait s. Probability a customer has to wait A. Consider a system with two servers in parallel who serve customers from a single line. Customers are served in a First-Come First-Served fashion. If both servers are available, customers always go to server 1 first. Given the inter-arrival times and service time for the following five customers, complete the tables below. 2 Customer #Inter-arrival time (min) Service Time (min) 5.82 3.35 5.26 3 1.65 3.02 4 3.52 5.51 5 2.27 2.05 Time of arrival Entity] (arrival time) (minutes) 0.00 Wait time (minutes) Service time (minutes) Time of Departure (minutes) Total time in the system (minutes) 2 3 4 5 Clock System State Future Event List Comments LQ) LS(t) Cumulative Statistics Servers 1 and 2 Bland 2 respectively Busy Time BI B2 0.00 B. From the hand simulation you just did, calculate the following metrics: 1. Proportion of server busy time for each teller (also known as utilization) 2. Average time a customer spends in the system 3. Average waiting time for a customer 4. Average wait time of those who wait s. Probability a customer has to wait A. Consider a system with two servers in parallel who serve customers from a single line. Customers are served in a First-Come First-Served fashion. If both servers are available, customers always go to server 1 first. Given the inter-arrival times and service time for the following five customers, complete the tables below. Customer #Inter-arrival time (min) Service Time (min) 5.82 2 3.35 5.26 3 1.65 3.02 4 3.52 5.51 5 2.27 2.05 Time of arrival Entity (arrival time) (minutes) Wait time (minutes) Service time (minutes) Time of Departure (minutes) Total time in the system (minutes) 0.00 2 3 4 5 Chrisuaire Man LO. 000 B. From the hand simulation you just did, calculate the following metrics: 1. Proportion of server busy time for each teller (also known as utilization) 2. Average time a customer spends in the system 3. Average waiting time for a customer Average wait time of those who wait s. Probability a customer has to wait A. Consider a system with two servers in parallel who serve customers from a single line. Customers are served in a First-Come First-Served fashion. If both servers are available, customers always go to server 1 first. Given the inter-arrival times and service time for the following five customers, complete the tables below. 2 Customer #Inter-arrival time (min) Service Time (min) 5.82 3.35 5.26 3 1.65 3.02 4 3.52 5.51 5 2.27 2.05 Time of arrival Entity] (arrival time) (minutes) 0.00 Wait time (minutes) Service time (minutes) Time of Departure (minutes) Total time in the system (minutes) 2 3 4 5 Clock System State Future Event List Comments LQ) LS(t) Cumulative Statistics Servers 1 and 2 Bland 2 respectively Busy Time BI B2 0.00 B. From the hand simulation you just did, calculate the following metrics: 1. Proportion of server busy time for each teller (also known as utilization) 2. Average time a customer spends in the system 3. Average waiting time for a customer 4. Average wait time of those who wait s. Probability a customer has to wait
Step by Step Solution
There are 3 Steps involved in it

Get step-by-step solutions from verified subject matter experts