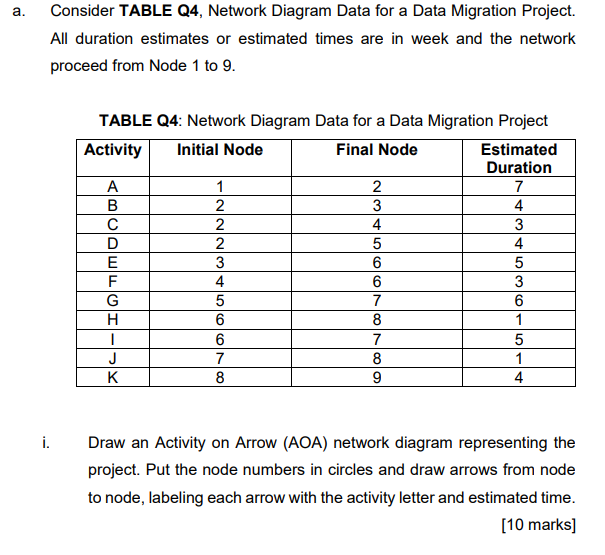
Question: a. Consider TABLE Q4, Network Diagram Data for a Data Migration Project. All duration estimates or estimated times are in week and the network proceed

a. Consider TABLE Q4, Network Diagram Data for a

a. Consider TABLE Q4, Network Diagram Data for a Data Migration Project. All duration estimates or estimated times are in week and the network proceed from Node 1 to 9. TABLE Q4: Network Diagram Data for a Data Migration Project Activity Initial Node Final Node Estimated Duration A 1 2 7 B 2 3 4 2 4 3 D 2 5 4 E 3 6 5 F 4 6 3 G 5 7 6 H 6 8 1 1 6 7 5 J 7 8 1 K 8 9 4 i. Draw an Activity on Arrow (AOA) network diagram representing the project. Put the node numbers in circles and draw arrows from node to node, labeling each arrow with the activity letter and estimated time. [10 marks]

Step by Step Solution

There are 3 Steps involved in it

1 Expert Approved Answer
Step: 1 Unlock blur-text-image
Question Has Been Solved by an Expert!

Get step-by-step solutions from verified subject matter experts

Step: 2 Unlock
Step: 3 Unlock

Students Have Also Explored These Related General Management Questions!