

Question: a) Consider the results for the four regression models given below. Models (1) and (2) are estimated using information on a cross-sectional sample of 209
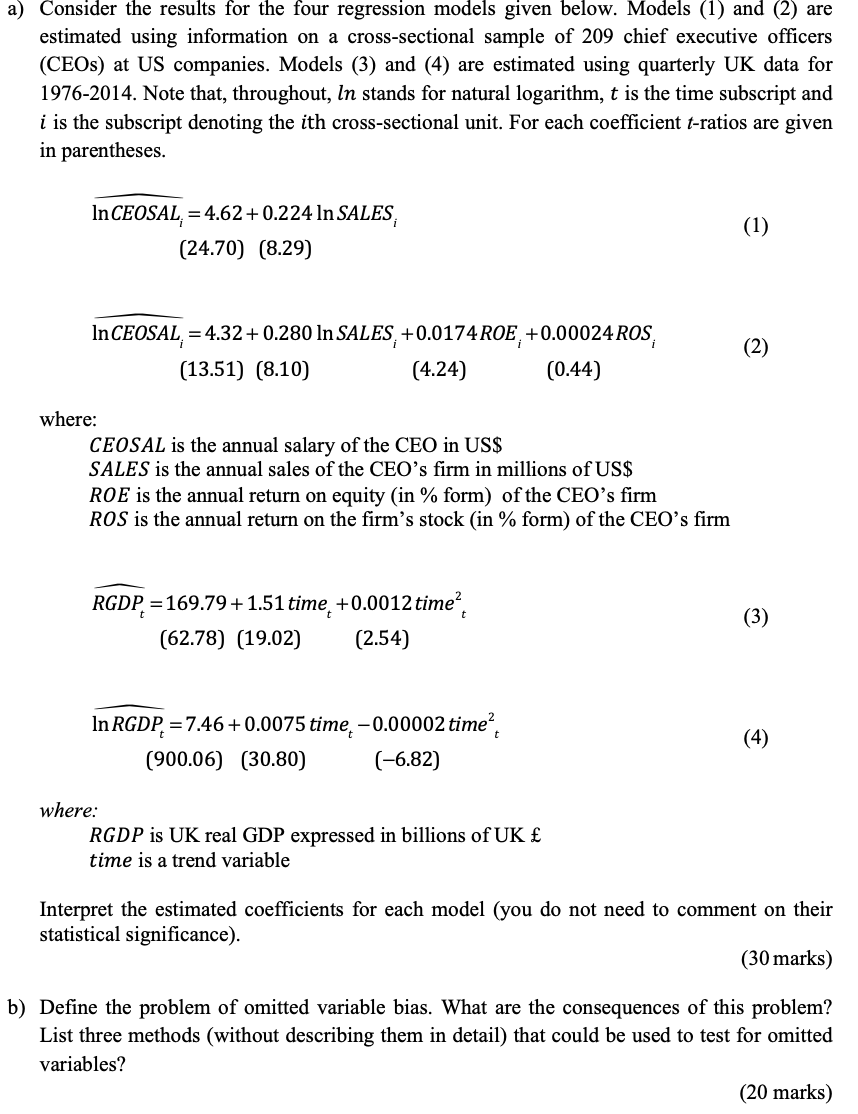
a) Consider the results for the four regression models given below. Models (1) and (2) are estimated using information on a cross-sectional sample of 209 chief executive officers (CEOs) at US companies. Models (3) and (4) are estimated using quarterly UK data for 1976-2014. Note that, throughout, In stands for natural logarithm, t is the time subscript and i is the subscript denoting the ith cross-sectional unit. For each coefficient t-ratios are given in parentheses. In CEOSAL, = 4.62+0.224 In SALES, (24.70) (8.29) In CEOSAL = 4.32 +0.280 In SALES, +0.0174 ROE, +0.00024 ROS, (13.51) (8.10) (4.24) (0.44) where: CEOSAL is the annual salary of the CEO in US$ SALES is the annual sales of the CEO's firm in millions of US$ ROE is the annual return on equity (in % form) of the CEO's firm ROS is the annual return on the firm's stock (in % form) of the CEO's firm RGDP = 169.79+1.51 time, +0.0012 time? (62.78) (19.02) (2.54) In RGDP. = 7.46+0.0075 time, -0.00002 time? (900.06) (30.80) (-6.82) where: RGDP is UK real GDP expressed in billions of UK time is a trend variable Interpret the estimated coefficients for each model (you do not need to comment on their statistical significance). (30 marks) b) Define the problem of omitted variable bias. What are the consequences of this problem? List three methods (without describing them in detail) that could be used to test for omitted variables? (20 marks) a) Consider the results for the four regression models given below. Models (1) and (2) are estimated using information on a cross-sectional sample of 209 chief executive officers (CEOs) at US companies. Models (3) and (4) are estimated using quarterly UK data for 1976-2014. Note that, throughout, In stands for natural logarithm, t is the time subscript and i is the subscript denoting the ith cross-sectional unit. For each coefficient t-ratios are given in parentheses. In CEOSAL, = 4.62+0.224 In SALES, (24.70) (8.29) In CEOSAL = 4.32 +0.280 In SALES, +0.0174 ROE, +0.00024 ROS, (13.51) (8.10) (4.24) (0.44) where: CEOSAL is the annual salary of the CEO in US$ SALES is the annual sales of the CEO's firm in millions of US$ ROE is the annual return on equity (in % form) of the CEO's firm ROS is the annual return on the firm's stock (in % form) of the CEO's firm RGDP = 169.79+1.51 time, +0.0012 time? (62.78) (19.02) (2.54) In RGDP. = 7.46+0.0075 time, -0.00002 time? (900.06) (30.80) (-6.82) where: RGDP is UK real GDP expressed in billions of UK time is a trend variable Interpret the estimated coefficients for each model (you do not need to comment on their statistical significance). (30 marks) b) Define the problem of omitted variable bias. What are the consequences of this problem? List three methods (without describing them in detail) that could be used to test for omitted variables? (20 marks)
Step by Step Solution
There are 3 Steps involved in it

Get step-by-step solutions from verified subject matter experts