

Question: a. Construct a yield curve graph (chart) using a spreadsheet program based on the above information. Make sure you label your axes. Hint: In Excel,
a. Construct a yield curve graph (chart) using a spreadsheet program based on the above information. Make sure you label your axes. Hint: In Excel, an XY scatter chart looks best.
b. Classify the shape of your yield curve, i.e. flat, downward (inverted), or upward (normal) sloping. Define what each shape means regarding the term structure of interest rates.
c. What does the shape of your yield curve mean about future interest rates according to the pure expectations theory and the market segmentation theory? Can liquidity preference theory explain the shape of your yield curve?
d. What is the expected one-year Treasury yield one year from today (the expected one-year rate for year 2) according to the expectations theory? What is the expected year 2 inflation rate if the real rate of interest (k*) is 2% according to this same theory?
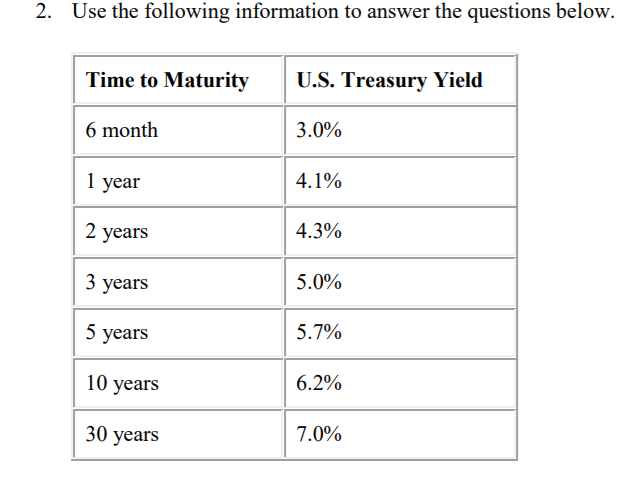
2. Use the following information to answer the questions below. Time to Maturity U.S. Treasury Yield 6 month 3.0% 1 year 4.1% 2 years 4.3% 3 years 5.0% 5 years 5.7% 10 years 6.2% 30 years 7.0% 2. Use the following information to answer the questions below. Time to Maturity U.S. Treasury Yield 6 month 3.0% 1 year 4.1% 2 years 4.3% 3 years 5.0% 5 years 5.7% 10 years 6.2% 30 years 7.0%
Step by Step Solution
There are 3 Steps involved in it

Get step-by-step solutions from verified subject matter experts