

Question: a) Construct contingency tables based on total percentages , row percentages and column percentages b) Which type of percentage - row , column or total
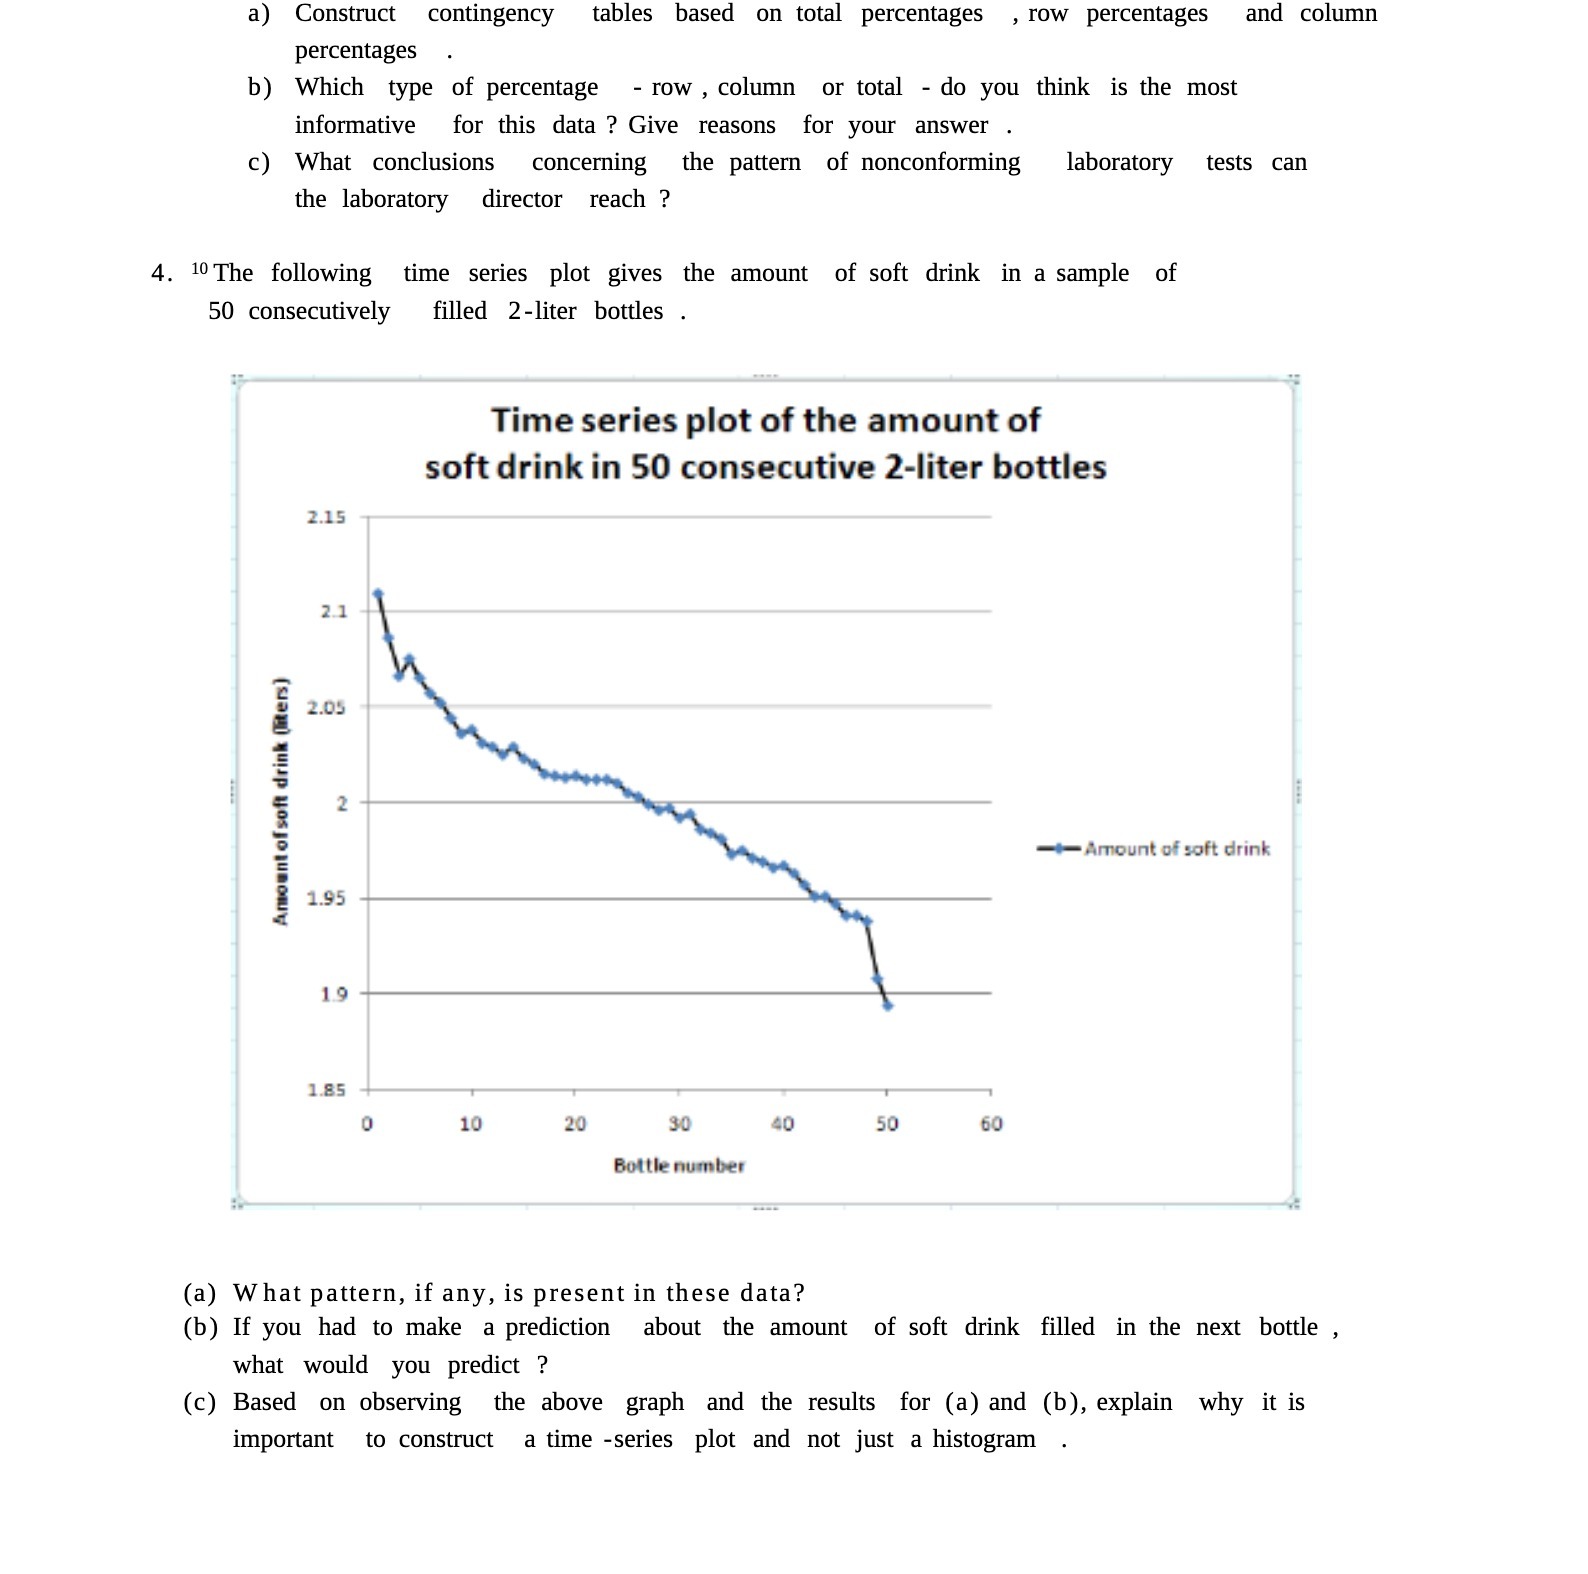
a) Construct contingency tables based on total percentages , row percentages and column percentages b) Which type of percentage - row , column or total - do you think is the most informative for this data ? Give reasons for your answer . c) What conclusions concerning the pattern of nonconforming laboratory tests can the laboratory director reach ? 4. 1The following time series plot gives the amount of soft drink in a sample of 50 consecutively lled 2-]iter bottles . Time series plot of the amount of soft drink in 50 consecutive 2-Iiter bottles 2.15 ' 271 ' N a u- qAmunt of soft drink 1.95 Amunl ell- In! lieu} H [9 1.35 O 10 20 3-0 '0 50 60 Bottle mil-e- (a) What pattern, if any, is present in these data? (b) If you had to make a prediction about the amount of soft drink filled in the next bottle , what would you predict ? (c) Based on observing the above graph and the results for (a) and (b), explain why it is important to construct a time -series plot and not just a histogram
Step by Step Solution
There are 3 Steps involved in it

Get step-by-step solutions from verified subject matter experts