

Question: a) construct position vs time graph for the subway shuttel as shown below and also construct a velocity graph for the subway shuttle train showing
a) construct position vs time graph for the subway shuttel as shown below and also construct a velocity graph for the subway shuttle train showing velocity in m/s from 0 to 20s . The average acceleration is 5 m/s square and the starting velocity of the train id 0 m/s
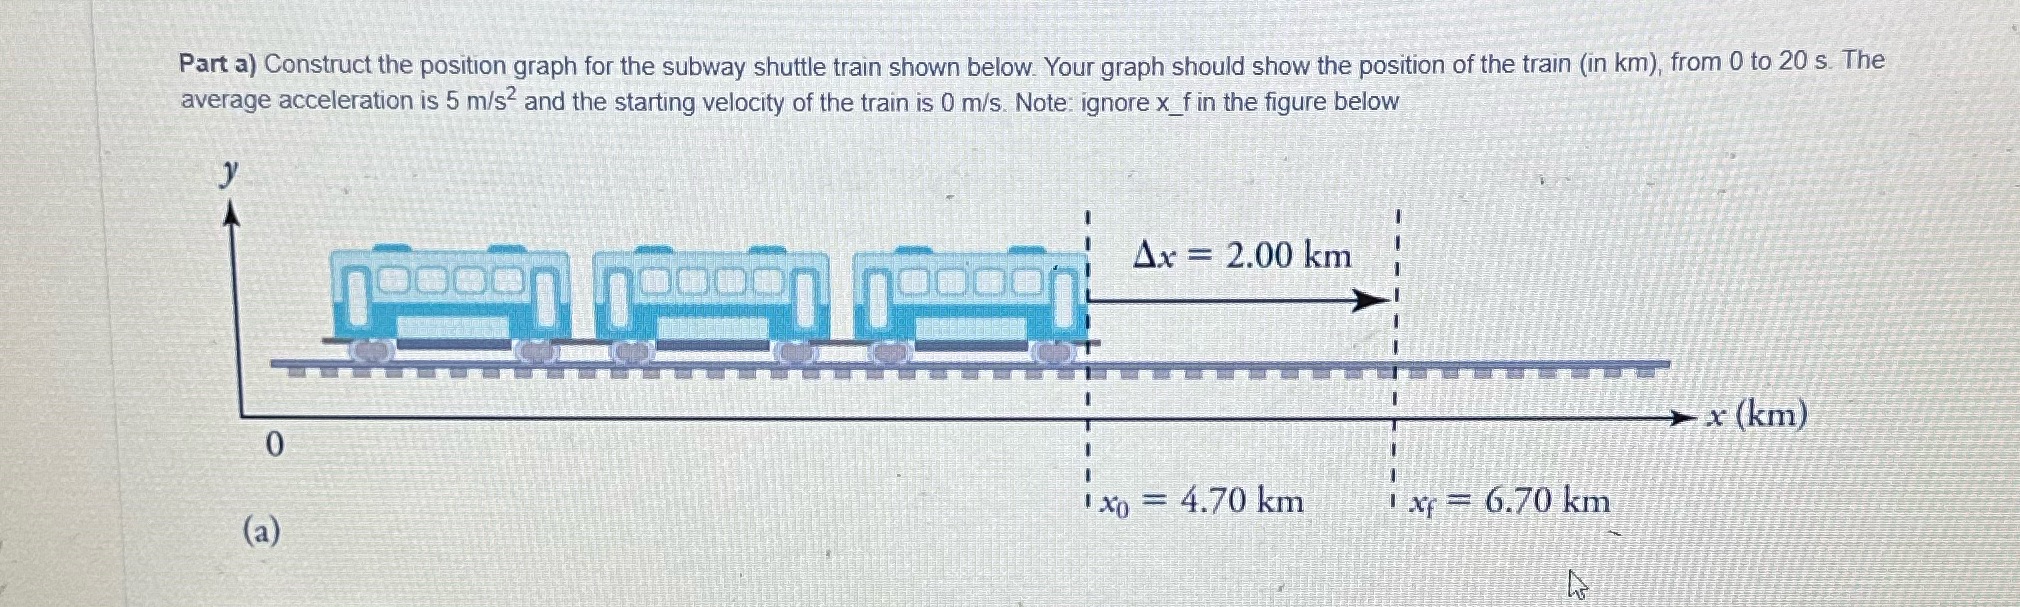
Part a) Construct the position graph for the subway shuttle train shown below. Your graph should show the position of the train (in km), from 0 to 20 s. The average acceleration is 5 m/s and the starting velocity of the train is 0 m/s. Note: ignore x_f in the figure below Ax = 2.00 km x (km) o = 4.70 km 1 xf = 6.70 km (a)
Step by Step Solution
There are 3 Steps involved in it
1 Expert Approved Answer
Step: 1 Unlock

Question Has Been Solved by an Expert!
Get step-by-step solutions from verified subject matter experts
Step: 2 Unlock
Step: 3 Unlock