

Question: A. construct the control charts for the mean and the range using the original 15 samples B. on the control charts developed in part A,
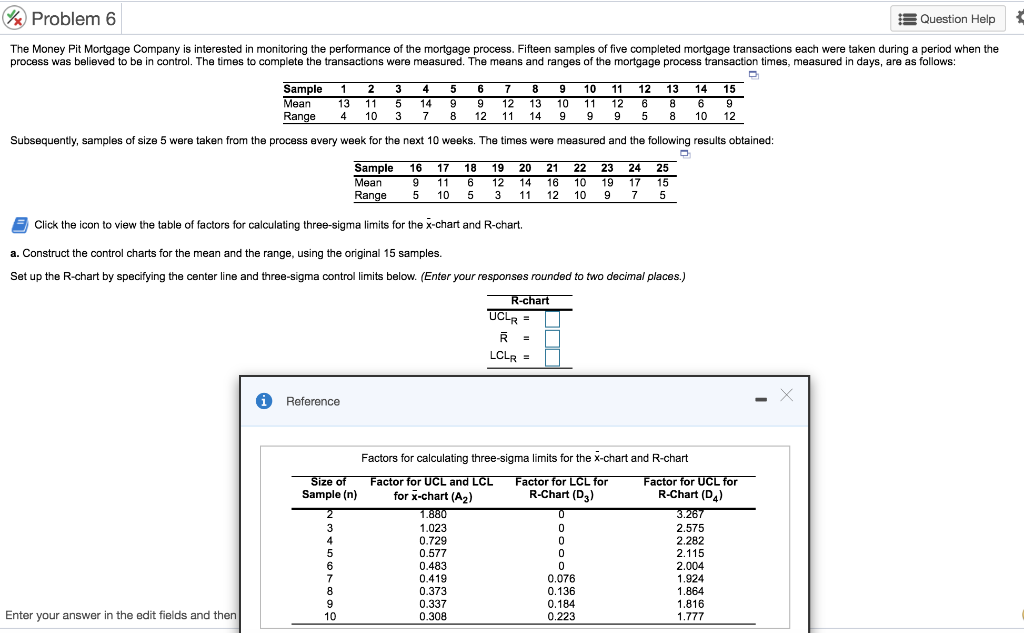
A. construct the control charts for the mean and the range using the original 15 samples
B. on the control charts developed in part A, plot the values from samples 16 through 25 and comment on whether the process is in control.
Step by Step Solution
There are 3 Steps involved in it
1 Expert Approved Answer
Step: 1 Unlock

Question Has Been Solved by an Expert!
Get step-by-step solutions from verified subject matter experts
Step: 2 Unlock
Step: 3 Unlock