

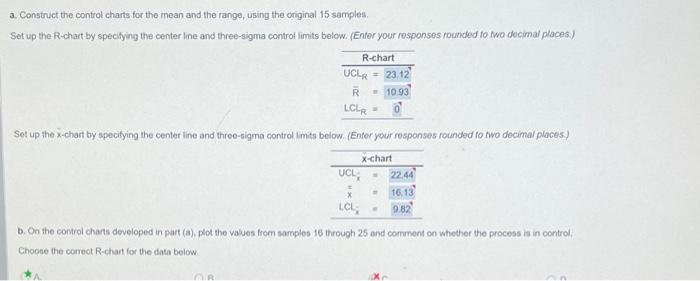
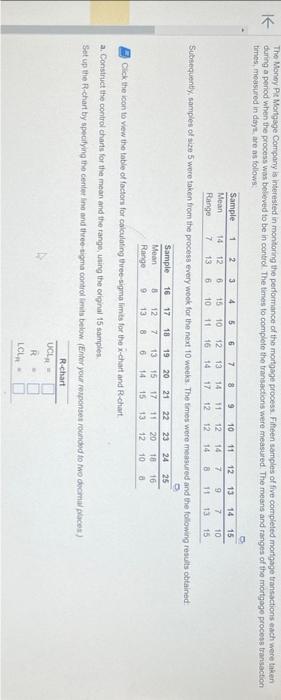
Question: a. Construct the control charts for the mean and the range, using the criginal 15 samples. Set up the R-chart by specifying the center line
Step by Step Solution
There are 3 Steps involved in it
1 Expert Approved Answer
Step: 1 Unlock

Question Has Been Solved by an Expert!
Get step-by-step solutions from verified subject matter experts
Step: 2 Unlock
Step: 3 Unlock