

Question: A contour diagram for a function f(x, y) is shown below. 23 of 21 2 5 Estimate the position and approximate value of the
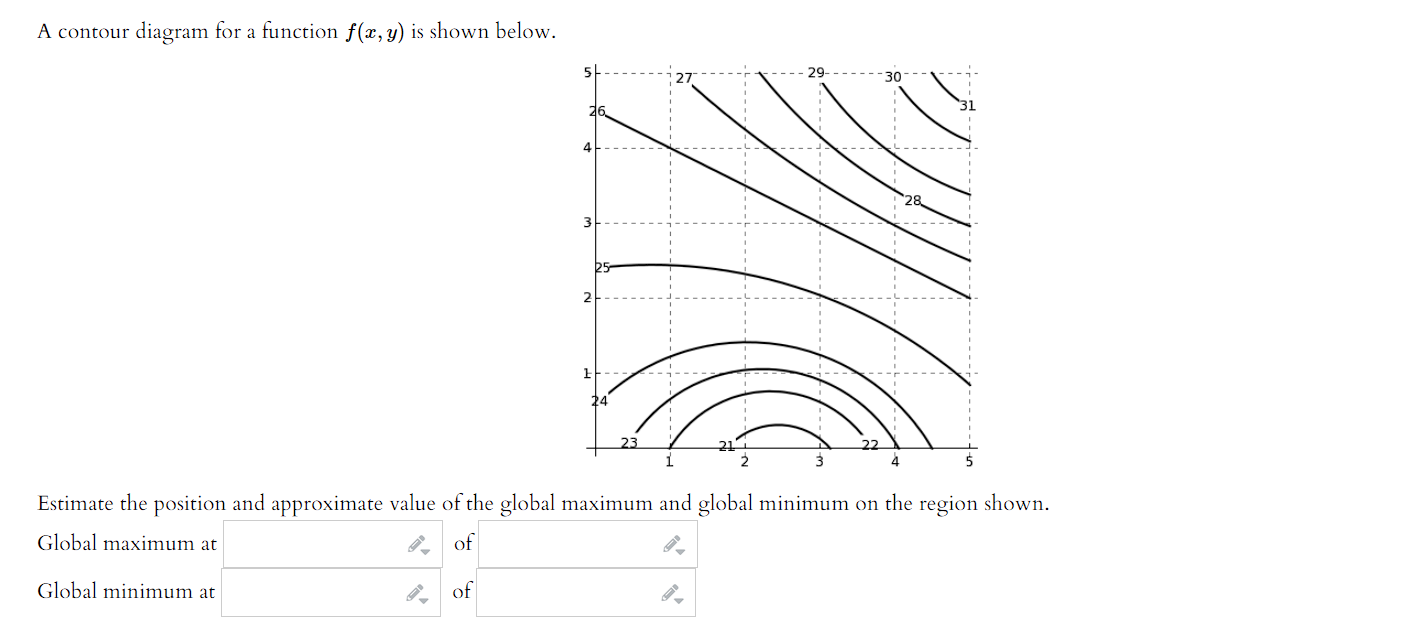
A contour diagram for a function f(x, y) is shown below. 23 of 21 2 5 Estimate the position and approximate value of the global maximum and global minimum on the region shown. Global maximum at of Global minimum at
Step by Step Solution
★★★★★
3.51 Rating (154 Votes )
There are 3 Steps involved in it
1 Expert Approved Answer
Step: 1 Unlock

Global maximum occurs approximately at 25 5 contour lines show maximum v... View full answer
Question Has Been Solved by an Expert!
Get step-by-step solutions from verified subject matter experts
Step: 2 Unlock
Step: 3 Unlock