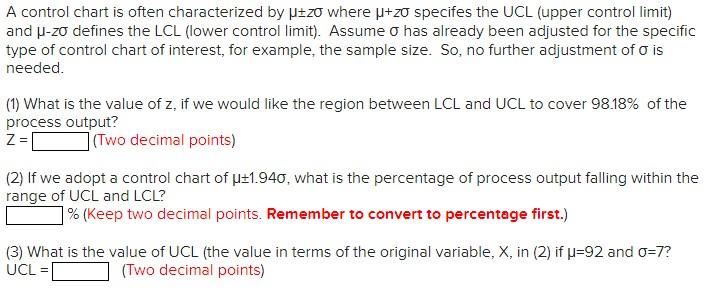
Question: A control chart is often characterized by pizo where u+zo specifes the UCL (upper control limit) and P-zo defines the LCL (lower control limit). Assume

A control chart is often characterized by pizo

A control chart is often characterized by pizo where u+zo specifes the UCL (upper control limit) and P-zo defines the LCL (lower control limit). Assume o has already been adjusted for the specific type of control chart of interest, for example, the sample size. So, no further adjustment of o is needed. (1) What is the value of Z, if we would like the region between LCL and UCL to cover 98.18% of the process output? Z= (Two decimal points) (2) If we adopt a control chart of u=1.940, what is the percentage of process output falling within the range of UCL and LCL? ] % (Keep two decimal points. Remember to convert to percentage first.) (3) What is the value of UCL (the value in terms of the original variable, X, in (2) if p=92 and O=7? UCLE (Two decimal points)

Step by Step Solution

There are 3 Steps involved in it

1 Expert Approved Answer
Step: 1 Unlock blur-text-image
Question Has Been Solved by an Expert!

Get step-by-step solutions from verified subject matter experts

Step: 2 Unlock
Step: 3 Unlock

Students Have Also Explored These Related General Management Questions!