

Question: A. Create a data using the different categories from the given problem below. B. Analyze the data using chi-square test. Problem 1: CHI-SQUARE PROBLEMS A
A. Create a data using the different categories from the given problem below.
B. Analyze the data using chi-square test.
Problem 1:

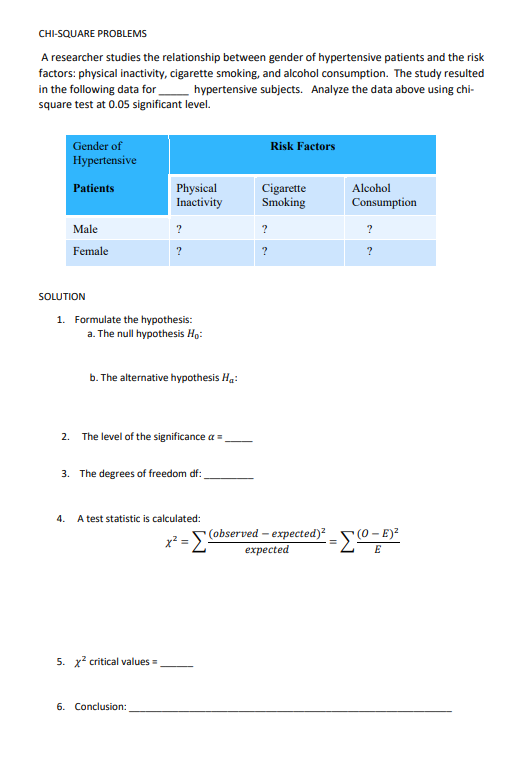
CHI-SQUARE PROBLEMS A hospital allocates much of their budget in preparation for the top two seasonal diseases in the locality. Based on their records, the frequencies of seasonal diseases occurring in the locality are given in the following table: Disease A Disease B % Others % Of current patients in the hospital, _suffer with Disease A, _suffer with Disease B, and suffer with other seasonal diseases. The hospital wants to know if their budget is sufficient by checking whether the above frequencies fit the data from their records. Analyze the problem using chi-square test at 0.05 significant level. SOLUTION 1. Formulate the hypothesis: a. The null hypothesis Ho: b. The alternative hypothesis H.: 2. The level of the significance a = 3. The degrees of freedom of: 4. A test statistic is calculated: x2 = S (observed - expected) "(0 - E)2 expected E 5. x' critical values = 6. Conclusion:CHI-SQUARE PROBLEMS A researcher studies the relationship between gender of hypertensive patients and the risk factors: physical inactivity, cigarette smoking, and alcohol consumption. The study resulted in the following data for hypertensive subjects. Analyze the data above using chi- square test at 0.05 significant level. Gender of Risk Factors Hypertensive Patients Physical Cigarette Alcohol Inactivity Smoking Consumption Male Female SOLUTION 1. Formulate the hypothesis: a. The null hypothesis Ho: b. The alternative hypothesis H.: 2. The level of the significance a =_ 3. The degrees of freedom df: . A test statistic is calculated: x2 = \\ (observed - expected)? = (0 - E)2 expected E 5. xz critical values = 6. Conclusion
Step by Step Solution
There are 3 Steps involved in it

Get step-by-step solutions from verified subject matter experts