

Question: a) Create an appropriate chart based on the information given. The chart should compare the breakdown of cases by state. b) Summarize the information by
a) Create an appropriate chart based on the information given. The chart should compare the breakdown of cases by state.
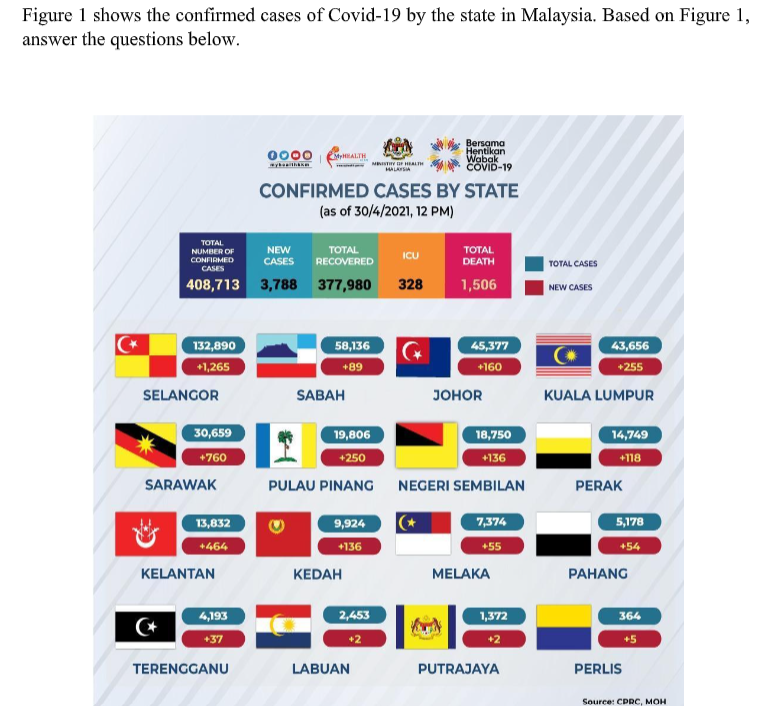
b) Summarize the information by selecting and reporting the main features and make comparisons, where relevant (150 to 250 words).
Figure 1 shows the confirmed cases of Covid-19 by the state in Malaysia. Based on Figure 1, answer the questions below. 0000 , Bersama Hentikan Wabak COVID-19 MINTHY DIF HEALTH CONFIRMED CASES BY STATE (as of 30/4/2021, 12 PM) TOTAL NUMBER OF CONFIRMED CASES ICU NEW TOTAL CASES RECOVERED 408,713 3,788 377,980 328 TOTAL CASES TOTAL DEATH 1,506 NEW CASES G C 132,890 +1,265 SELANGOR 58,136 +89 SABAH 45,377 +160 JOHOR 43,656 +255 KUALA LUMPUR 18,750 14,749 30,659 +760 SARAWAK LI 19,806 +250 PULAU PINANG +136 +118 NEGERI SEMBILAN PERAK 7,374 13,832 +464 KELANTAN 9,924 +136 KEDAH +55 5,178 +54 PAHANG MELAKA 4,193 2,453 364 1,372 +2 +37 +2 +5 TERENGGANU LABUAN PUTRAJAYA PERLIS Source: CPRC, MOHStep by Step Solution
There are 3 Steps involved in it
1 Expert Approved Answer
Step: 1 Unlock

Question Has Been Solved by an Expert!
Get step-by-step solutions from verified subject matter experts
Step: 2 Unlock
Step: 3 Unlock