Question: A critical parameter is monitored on a process, and measurements yield data from mean and range computations During every sample period, 5 observations are recorded.
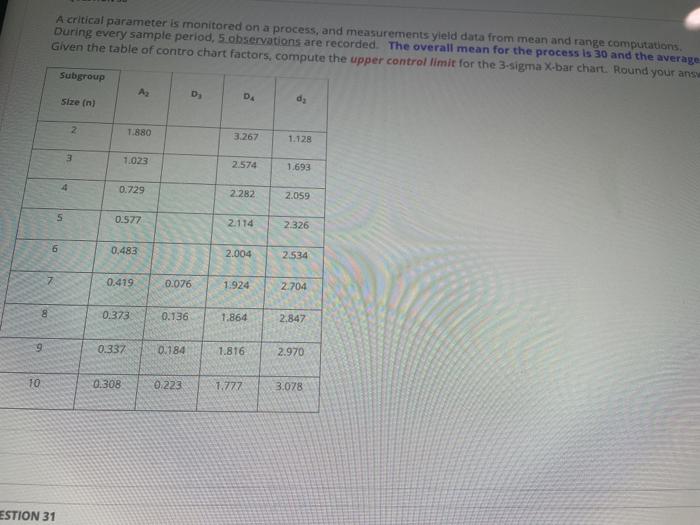
A critical parameter is monitored on a process, and measurements yield data from mean and range computations During every sample period, 5 observations are recorded. The overall mean for the process is 30 and the average Given the table of contro chart factors, compute the upper control limit for the 3-sigma X-bar chart. Round your ans Subgroup D Size (n) DA d 2 1.880 3.267 1.128 3 1.023 2574 1.693 0.729 2282 2.059 5 0.577 2.114 2.326 0,483 2.004 2.534 7 0.419 0.076 1.924 2.704 0.373 0.136 1.864 2.847 9 0.337 0.184 1.816 2.970 10 0.308 0.223 1,777 3.078 ESTION 31 A critical parameter is monitored on a process, and measurements yield data from mean and range computations During every sample period, 5 observations are recorded. The overall mean for the process is 30 and the average Given the table of contro chart factors, compute the upper control limit for the 3-sigma X-bar chart. Round your anse Subgroup Az D 04 Size (n) dy 2 1.880 3.267 1.128 1.023 2.574 1.693 0.729 2282 2.059 5 0.577 2.114 2.326 5 0,483 2.004 2.534 7 0.419 0.076 1.924 2.704 0.373 0.136 1.864 2.847 9 0.337 0.184 1.816 2.970 10 0.308 0.223 1.777 3.078 ESTION 31 A critical parameter is monitored on a process, and measurements yield data from mean and range computations During every sample period, 5 observations are recorded. The overall mean for the process is 30 and the average Given the table of contro chart factors, compute the upper control limit for the 3-sigma X-bar chart. Round your ans Subgroup D Size (n) DA d 2 1.880 3.267 1.128 3 1.023 2574 1.693 0.729 2282 2.059 5 0.577 2.114 2.326 0,483 2.004 2.534 7 0.419 0.076 1.924 2.704 0.373 0.136 1.864 2.847 9 0.337 0.184 1.816 2.970 10 0.308 0.223 1,777 3.078 ESTION 31 A critical parameter is monitored on a process, and measurements yield data from mean and range computations During every sample period, 5 observations are recorded. The overall mean for the process is 30 and the average Given the table of contro chart factors, compute the upper control limit for the 3-sigma X-bar chart. Round your anse Subgroup Az D 04 Size (n) dy 2 1.880 3.267 1.128 1.023 2.574 1.693 0.729 2282 2.059 5 0.577 2.114 2.326 5 0,483 2.004 2.534 7 0.419 0.076 1.924 2.704 0.373 0.136 1.864 2.847 9 0.337 0.184 1.816 2.970 10 0.308 0.223 1.777 3.078 ESTION 31