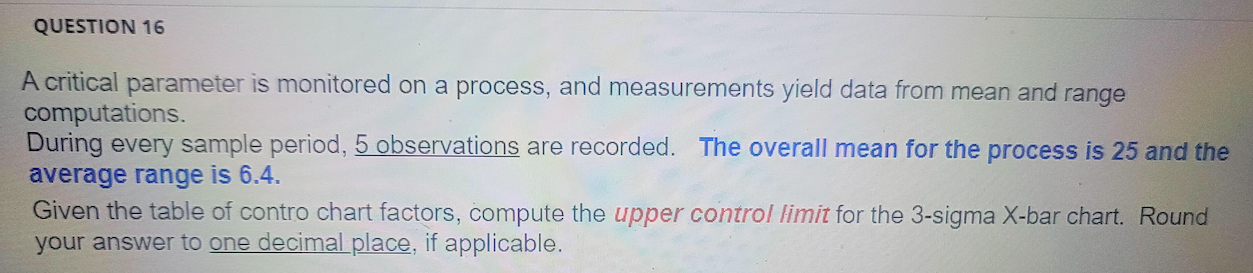
Question: A critical parameter is monitored on a process, and measurements yield data from mean and range computations. During every sample period, 5 observations are recorded.

A critical parameter is monitored on a process,

A critical parameter is monitored on a process,

A critical parameter is monitored on a process, and measurements yield data from mean and range computations. During every sample period, 5 observations are recorded. The overall mean for the process is 25 and the average range is 6.4. Given the table of contro chart factors, compute the upper control limit for the 3-sigma X-bar chart. Round your answer to one decimal place, if applicable. \begin{tabular}{|c|c|c|c|c|} \hline Subgroup & A2 & D3 & D4 & d2 \\ \hline Size (n) & & & & \\ \hline 2 & 1.880 & & 3.267 & 1.128 \\ \hline 3 & 1.023 & & 2.574 & 1.693 \\ \hline 4 & 0.729 & & 2.282 & 2.059 \\ \hline 5 & 0.577 & & 2.114 & 2.326 \\ \hline 6 & 0.483 & & 2.004 & 2.534 \\ \hline 7 & 0.419 & 0.076 & 1.924 & 2.704 \\ \hline 8 & 0.373 & 0.136 & 1.864 & 2.847 \\ \hline 9 & 0.337 & 0.184 & 1.816 & 2.970 \\ \hline & & & & \\ \hline & & & & \\ \hline \end{tabular}

Step by Step Solution

There are 3 Steps involved in it

1 Expert Approved Answer
Step: 1 Unlock blur-text-image
Question Has Been Solved by an Expert!

Get step-by-step solutions from verified subject matter experts

Step: 2 Unlock
Step: 3 Unlock

Students Have Also Explored These Related General Management Questions!