

Question: A data set is given below. [a] Draw a scatter diagram. Comment on the type of relation that appears to exist between x and y.
![A data set is given below. [a] Draw a scatter diagram.](https://s3.amazonaws.com/si.experts.images/answers/2024/06/66681538c2a5e_20866681538a9a4b.jpg)
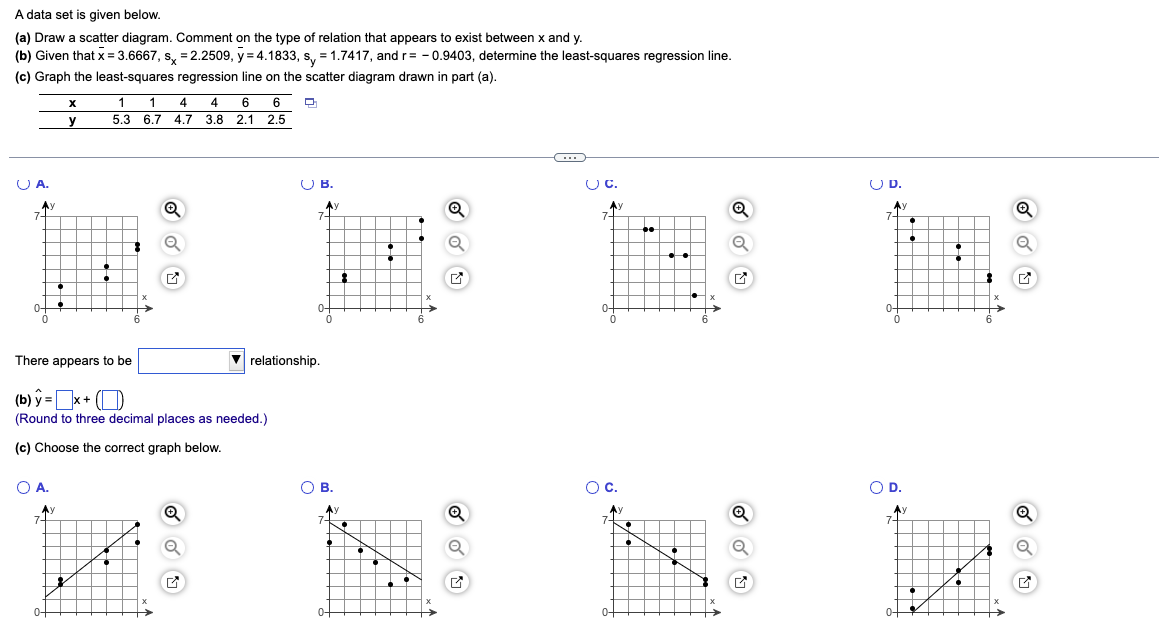
A data set is given below. [a] Draw a scatter diagram. Comment on the type of relation that appears to exist between x and y. [b] Given that x = 3.6667, 5x = 2.2509, y = 4.1333. 53' =1.?41?' and r = 0.9403. determine the leastsquares regression line. [c] Graph the leastsquares regression line on the scatter diagram drawn in part (a). x 1 1 4 4 6 6 El y 5.3 6.? 4.? 3.8 2.1 2.5 U A. U H. U C. 7n a 7M 7:\" I Q 1 P? O x D f )- D D D 6 D D There appears to be relationship. {b1 y= x + ( } (Round to three decimal places as needed.) [c] Choose the correct graph below. 0 A. O B. O C. 7n a 7M 7:\" O Q C I"? x D )- D D U u. ?AY Q Q I"? at] O D. ?AY Q Q I"? i]
Step by Step Solution
There are 3 Steps involved in it

Get step-by-step solutions from verified subject matter experts