

Question: Test: POST UNIT B - TEST - Ch. 4 Question 7 This Test: 12 pts possible A data set is given below. (a) Draw a
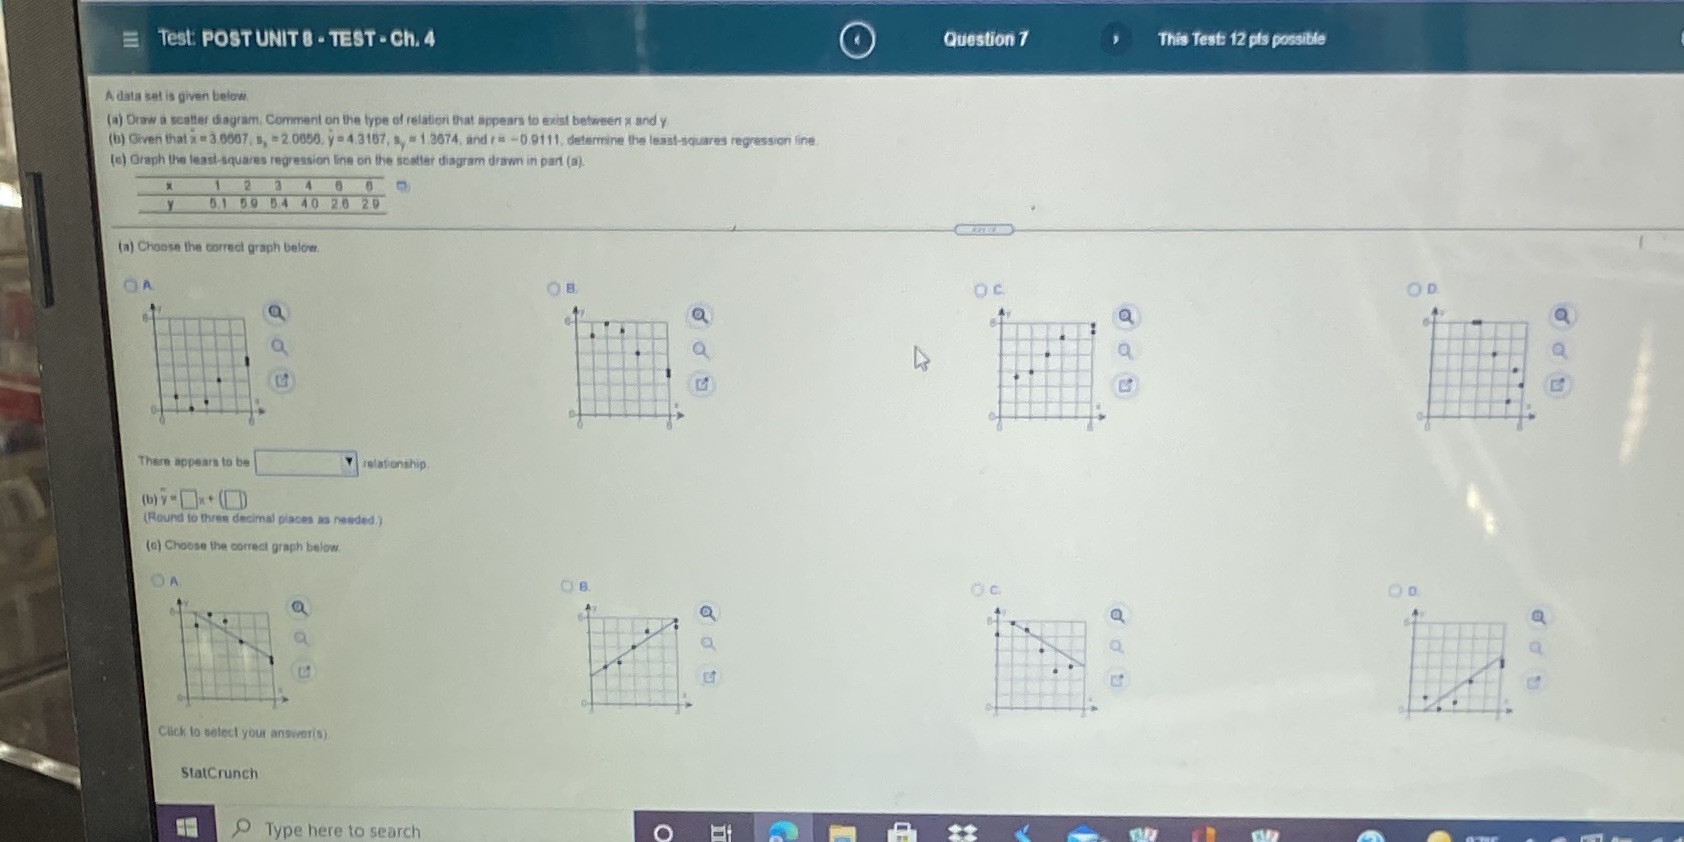
Test: POST UNIT B - TEST - Ch. 4 Question 7 This Test: 12 pts possible A data set is given below. (a) Draw a scatter diagram, Comment on the type of relation that appears to exist between a and y (b) Given that x = 3.0607, s, - 2.0850, y = 4.3107, s, = 1.3074, and rm -0.91 11, determine the least-squares regression line () Graph the least-squares regression line on the scatter diagram drawn in part (a]. 1 2 3 4 6 0 9 Y 0.1 09 04 40 20 20 (a) Choose the correct graph below. DA OB OC OD Q a a a There appears to be Y relationship (b) yx + (LD) (Round to three decimal places as needed.) (a) Choose the correct graph below. OA OD Click to select your answeris) StatCrunch Type here to search O
Step by Step Solution
There are 3 Steps involved in it

Get step-by-step solutions from verified subject matter experts