

Question: A Data Table (Click on the icon located on the top-right corner of the data table below in order to copy its contents into a
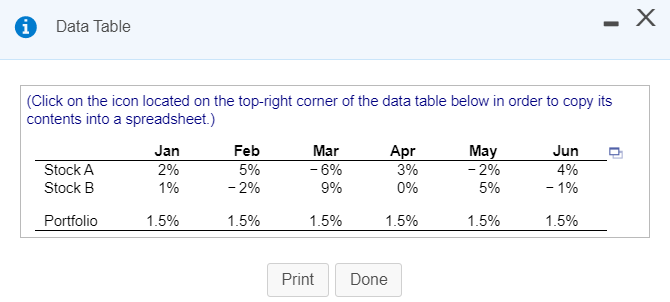
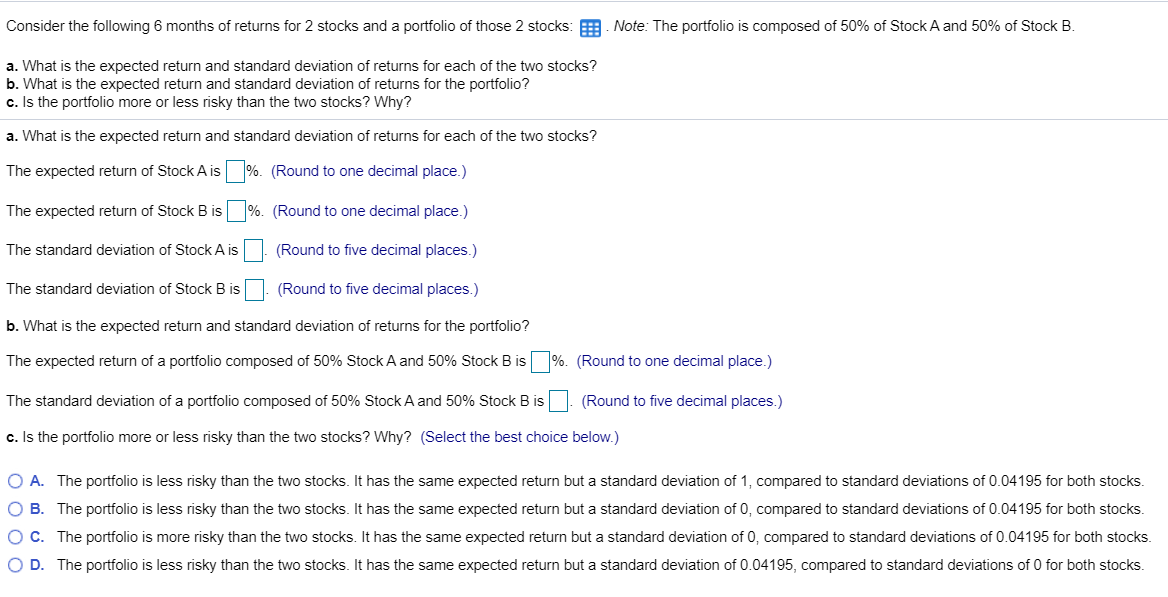
A Data Table (Click on the icon located on the top-right corner of the data table below in order to copy its contents into a spreadsheet.) Jan Feb Mar Apr May Jun Stock A 2% - 6% 3% -2% 4% Stock B - 2% 9% Portfolio 1.5% 1.5% 1.5% 1.5% 1.5% 1.5% 5% 1% 5% - 1% Print Done Consider the following 6 months of returns for 2 stocks and a portfolio of those 2 stocks: Note: The portfolio is composed of 50% of Stock A and 50% of Stock B. a. What is the expected return and standard deviation of returns for each of the two stocks? b. What is the expected return and standard deviation of returns for the portfolio? c. Is the portfolio more or less risky than the two stocks? Why? a. What is the expected return and standard deviation of returns for each of the two stocks? The expected return of Stock Ais %. (Round to one decimal place.) The expected return of Stock B is %. (Round to one decimal place.) The standard deviation of Stock Ais (Round to five decimal places.) The standard deviation of Stock Bis ). (Round to five decimal places.) b. What is the expected return and standard deviation of returns for the portfolio? The expected return of a portfolio composed of 50% Stock A and 50% Stock B is %. (Round to one decimal place.) The standard deviation of a portfolio composed of 50% Stock A and 50% Stock B is (Round to five decimal places.) c. Is the portfolio more or less risky than the two stocks? Why? (Select the best choice below.) O O A. The portfolio is less risky than the two stocks. It has the same expected return but a standard deviation of 1, compared to standard deviations of 0.04195 for both stocks. B. The portfolio is less risky than the two stocks. It has the same expected return but a standard deviation of O, compared to standard deviations of 0.04195 for both stocks. O C. The portfolio is more risky than the two stocks. It has the same expected return but a standard deviation of O, compared to standard deviations of 0.04195 for both stocks. D. The portfolio is less risky than the two stocks. It has the same expected return but a standard deviation of 0.04195, compared to standard deviations of O for both stocks. O
Step by Step Solution
There are 3 Steps involved in it

Get step-by-step solutions from verified subject matter experts