

Question: A data table with conditional formatting will help to better visualize the expenses, revenues, and net income of the business. Fill in the Expenses,
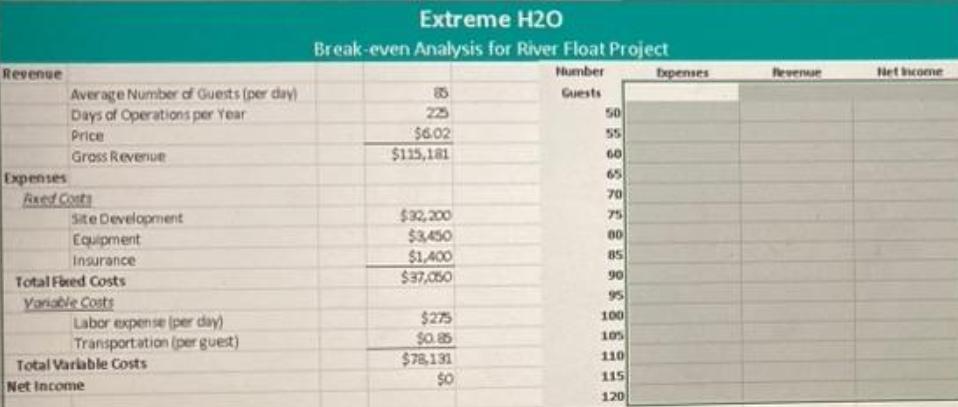
A data table with conditional formatting will help to better visualize the expenses, revenues, and net income of the business. Fill in the Expenses, Revenue, and Net Income columns (range G4:119) using a data table. Extreme H20 Break-even Analysis for River Float Project Revenue Humber bxpenses evenue Net come Average Number of Guests (per day) Days of Operations per Year Guests 225 $6.02 $115,181 50 Price Gross Revenue 60 65 70 75 Expenses Reed Conts Site Development Equipment Insurance $32,200 $3450 $1,400 $37,050 90 95 100 105 Total Fored Costs Variable Costs Labor expense (per day) Transportation (per guest) $275 $O.85 $78,131 110 Total Varlable Costs 115 Net Income 120
Step by Step Solution
3.40 Rating (150 Votes )
There are 3 Steps involved in it
Number guests Expenses 3705000 3705000 Revenue Net Income Revenue 50 6802600 ... View full answer

Get step-by-step solutions from verified subject matter experts