

Question: a. Describe why Uber's capacity utilization rate is higher than Taxi service in major cities like Los Angeles, San Francisco, Boston etc. b. Why the
a. Describe why Uber's capacity utilization rate is higher than Taxi service in major cities like Los Angeles, San Francisco, Boston etc.
b. Why the same in New York?
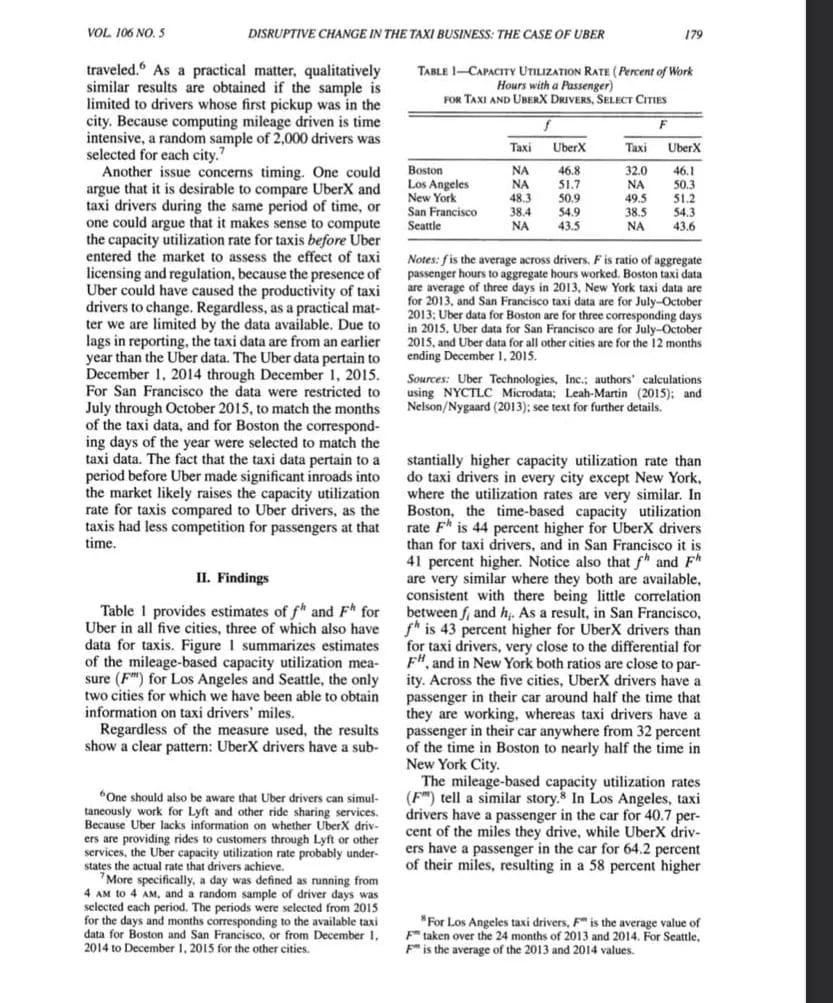
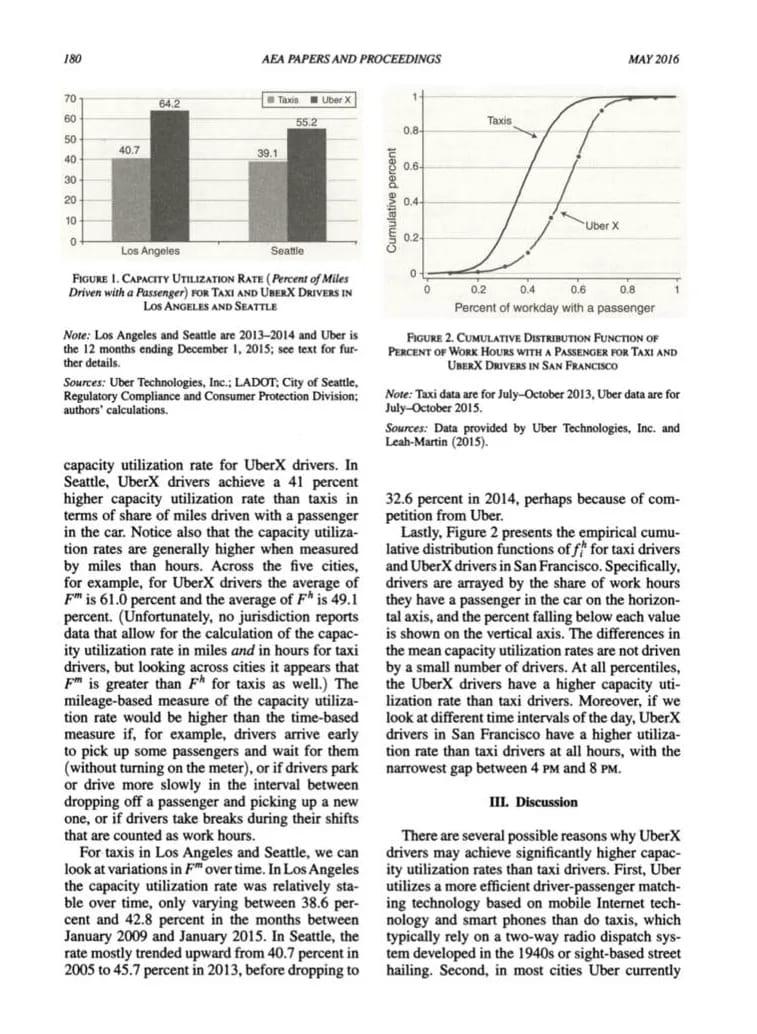
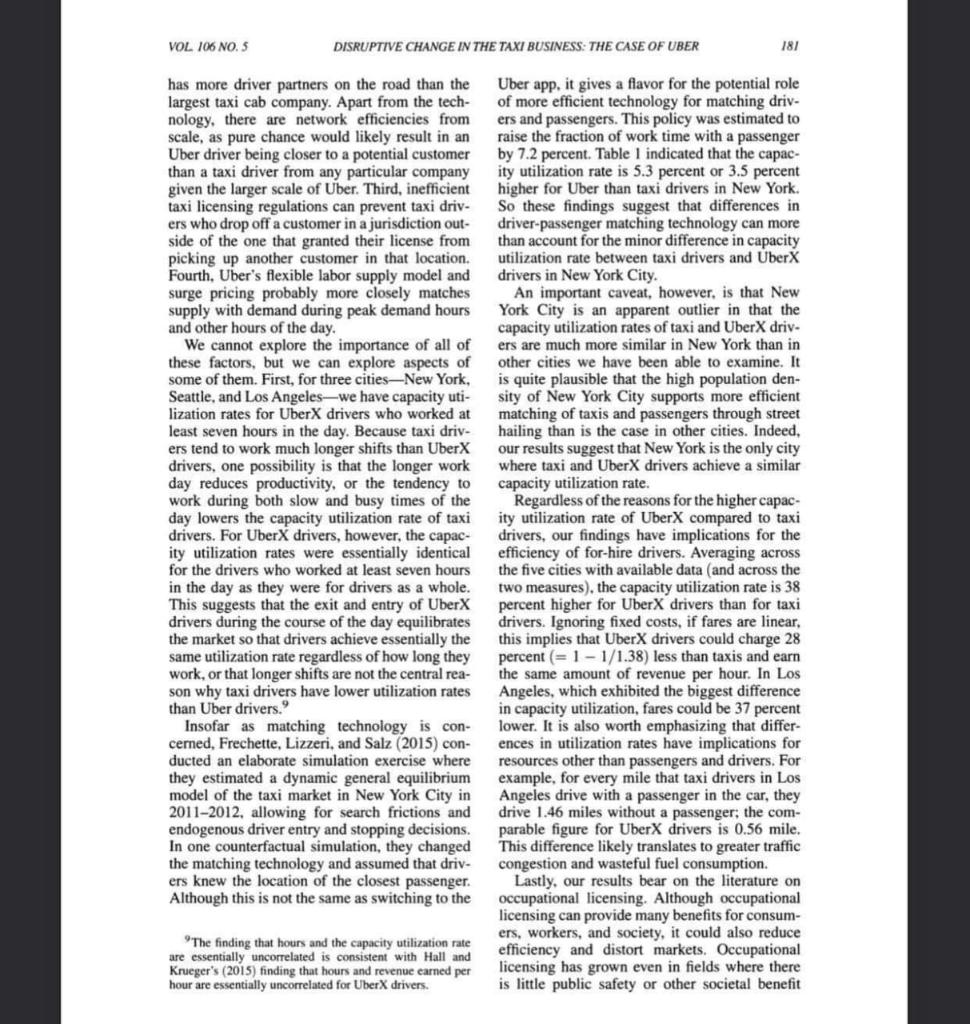
VOL 106 NO. 5 DISRUPTIVE CHANGE IN THE TAXI BUSINESS: THE CASE OF UBER 179 traveled. 6 As a practical matter, qualitatively TABLE 1-Capsciry Umuzsnon Ratz ( Percent of Work similar results are obtained if the sample is Hours with a Passenger) similar results are obtained if the sample is limited to drivers whose first pickup was in the city. Because computing mileage driven is time intensive, a random sample of 2,000 drivers was selected for each city. 7 Another issue concerns timing. One could argue that it is desirable to compare UberX and taxi drivers during the same period of time, or one could argue that it makes sense to compute the capacity utilization rate for taxis before Uber enteredthemarkettoassesstheeffectoftaxilicensingandregulation,becausethepresenceofUbercouldhavecausedtheproductivityoftaxidriverstochange.Regardless,asapracticalmat-terwearelimitedbythedataavailable.Duetolagsinreporting,thetaxidataarefromanearlieryearthantheUberdata.TheUberdatapertaintoDecember1.2014throughDecember1,2015.Notes:fistheaverageacrossdrivers,Fisratioofaggregatepassengerhourstoaggregatehoursworked.Bostontaxidataareaverageofthreedaysin2013,NewYorktaxidataarefor2013,andSanFranciscotaxidataareforJuly-October2013:UberdataforBostonareforthreecorrespondingdays2015,andUberdataforSanFranciscoareforJuly-OctoberendingDecember1.2015.Sources:UberTechnologies,Inc.iauthorscalculations For San Francisco the data were restricted to using NYCTLC Microdata; Leah-Martin (2015); and July through October 2015 , to match the months of the taxi data, and for Boston the correspond- ing days of the year were selected to match the period before Uber made significant inroads into do taxi drivers in every city except New York, the market likely raises the capacity utilization where the utilization rates are very similar. In rate for taxis compared to Uber drivers, as the Boston, the time-based capacity utilization taxis had less competition for passengers at that rate Fh is 44 percent higher for Uber X drivers taxishadlesscompetitionforpassengersatthattime.rateFhis44percenthigherforUberXdriversthanfortaxidrivers,andinSanFranciscoitis 41 percent higher. Notice also that fh and Fh II. Findings are very similar where they both are available, consistent with there being little correlation Table 1 provides estimates of fh and Fh for between fi and hi. As a result, in San Francisco, Uber in all five cities, three of which also have fh is 43 percent higher for UberX drivers than data for taxis. Figure I summarizes estimates for taxi drivers, very close to the differential for of the mileage-based capacity utilization mea- FH, and in New York both ratios are close to parsure (Fm) for Los Angeles and Seattle, the only ity. Across the five cities, UberX drivers have a twocitiesforwhichwehavebeenabletoobtainpassengerintheircararoundhalfthetimethatinformationontaxidriversmiles.theyareworking,whereastaxidrivershavea Regardless of the measure used, the results are working, whereas taxi drivers have a passenger in their car anywhere from 32 percent show a clear pattern: UberX drivers have a sub- of the time in Boston to nearly half the time in New York City. The mileage-based capacity utilization rates 6 One should also be aware that Uber drivers can simul- (Fm ') tell a similar story. In Los Angeles, taxi taneously work for Lyft and other ride sharing services. drivers have a passenger in the car for 40.7 perBecause Uber lacks information on whether UberX driv. cent of the miles they drive, while UberX drivservices, the Uber capacity utilization rate probably under- ers have a passenger in the car for 64.2 percent states the actual rate that drivers achieve. 'More specifically, a day was defined as running from of their miles, resulting in a 58 percent higher 4 AM to 4 AM, and a random sample of driver days was selected each period. The periods were selected from 2015 for the days and months corresponding to the available taxi data for Boston and San. Francisco, of from. December 1. "For Los Angeles taxi drivers, F is the average value of 2014 to December I, 2015 for the other cities. Fm taken over the 24 months of 2013 and 2014. For Seattle, 180 AEA PAPERS AND PROCEEDINGS MAY 2016 Figune 1. CAPACTrY Utuzarion Rate (Percent of Miles Driven with a Passenger) Fon TAXI AND UaERX Drives IN LOS ANGELES AND SEATTLE capacity utilization rate for UberX drivers. In Seattle, UberX drivers achieve a 41 percent higher capacity utilization rate than taxis in 32.6 percent in 2014, perhaps because of comterms of share of miles driven with a passenger petition from Uber. in the car. Notice also that the capacity utiliza- Lastly, Figure 2 presents the empirical cumution rates are generally higher when measured lative distribution functions of fih for taxi drivers by miles than hours. Across the five cities, and UberX drivers in San Francisco. Specifically. for example, for UberX drivers the average of drivers are arrayed by the share of work hours Fm is 61.0 percent and the average of Fh is 49.1 they have a passenger in the car on the horizonFmpercent.(Unfortunately,nojurisdictionreportsis61.0percentandtheaverageofFhis49.1theyhaveapassengerinthecaronthehorizon-talaxis,andthepercentfallingbeloweachvalue percent. (Unfortunately, no jurisdiction reports tal axis, and the percent falling below each value data that allow for the calculation of the capac- is shown on the vertical axis. The differences in drivers, but looking across cities it appears that by a small number of drivers. At all percentiles, Fm is greater than Fh for taxis as well.) The the UberX drivers have a higher capacity utimileage-based measure of the capacity utiliza- lization rate than taxi drivers. Moreover, if we tion rate would be higher than the time-based look at different time intervals of the day, Uber X measure if, for example, drivers arrive early drivers in San Francisco have a higher utiliza(without turning on the meter), or if drivers park tion rate than taxi drivers at all hours, with the or drive more slowly in the interval between or drive more slowly in the interval between narrowest gap between 4 PM and 8 PM. one, or if drivers take breaks during their shifts III. Discussion that are counted as work hours. There are several possible reasons why UberX For taxis in Los Angeles and Seattle, we can drivers may achieve significantly higher capaclook at variations in Fm over time. In Los Angeles ity utilization rates than taxi drivers. First, Uber the capacity utilization rate was relatively sta- utilizes a more efficient driver-passenger matchble over time, only varying between 38.6 per- ing technology based on mobile Internet techcent and 42.8 percent in the months between nology and smart phones than do taxis, which ranuary 2009 and January 2015. In Seattle, the typically rely on a two-way radio dispatch sys2005 to 45.7 percent in 2013, before dropping to hailing. Second, in most cities Uber currently VOL 106 NO.5 DISRUPTIVE CHANGE IN THE TAXI BUSINESS: THE CASE OF UBER 181 has more driver partners on the road than the Uber app, it gives a flavor for the potential role largest taxi cab company. Apart from the tech- of more efficient technology for matching drivnology, there are network efficiencies from ers and passengers. This policy was estimated to scale, as pure chance would likely result in an raise the fraction of work time with a passenger Uber driver being closer to a potential customer by 7.2 percent. Table 1 indicated that the capacthan a taxi driver from any particular company ity utilization rate is 5.3 percent or 3.5 percent giventhelargerscaleofUber.Third,inefficienttaxilicensingregulationscanpreventtaxidriv.higherforUberthantaxidriversinNewYork.Sothesefindingssuggestthatdifferencesin taxilicensingregulationscanpreventtaxidriv-erswhodropoffacustomerinajurisdictionout-Sothesefindingssuggestthatdifferencesindriver-passengermatchingtechnologycanmore side of the one that granted their license from than account for the minor difference in capacity picking up another customer in that location. utilization rate between taxi drivers and UberX Fourth, Uber's flexible labor supply model and drivers in New York City. surge pricing probably more closely matches An important caveat, however, is that New supply with demand during peak demand hours York City is an apparent outlier in that the and other hours of the day. these factors, but we can explore aspects of other cities we have been able to examine. It some of them. First, for three cities-New York, is quite plausible that the high population denSeattle, and Los Angeles - we have capacity uti- sity of New York City supports more efficient lization rates for UberX drivers who worked at matching of taxis and passengers through street least seven hours in the day. Because taxi driv- hailing than is the case in other cities. Indeed, ers tend to work much longer shifts than UberX our results suggest that New York is the only city drivers, one possibility is that the longer work where taxi and Uber X drivers achieve a similar day reduces productivity, or the tendency to capacity utilization rate. work during both slow and busy times of the Regardless of the reasons for the higher capacday lowers the capacity utilization rate of taxi ity utilization rate of UberX compared to taxi drivers. For UberX drivers, however, the capac- drivers, our findings have implications for the for the drivers who worked at least seven hours the five cities with available data (and across the in the day as they were for drivers as a whole. two measures), the capacity utilization rate is 38 This suggests that the exit and entry of UberX percent higher for UberX drivers than for taxi drivers during the course of the day equilibrates drivers. Ignoring fixed costs, if fares are linear, the market so that drivers achieve essentially the this implies that UberX drivers could charge 28 same utilization rate regardless of how long they percent (=11/1.38) less than taxis and earn work, or that longer shifts are not the central rea- the same amount of revenue per hour. In Los son why taxi drivers have lower utilization rates than Uber drivers. 9 Insofar as matching technology is con- lower. It is also worth emphasizing that differcerned, Frechette, Lizzeri, and Salz (2015) con- ences in utilization rates have implications for ducted an elaborate simulation exercise where resources other than passengers and drivers. For they estimated a dynamic general equilibrium example, for every mile that taxi drivers in Los model of the taxi market in New York City in Angeles drive with a passenger in the car, they 2011-2012, allowing for search frictions and drive 1.46 miles without a passenger; the comendogenous driver entry and stopping decisions. parable figure for Uber X drivers is 0.56 mile. In one counterfactual simulation, they changed This difference likely translates to greater traffic the matching technology and assumed that driv- congestion and wasteful fuel consumption. ers knew the location of the closest passenger. Lastly, our results bear on the literature on Although this is not the same as switching to the occupational licensing. Although occupational licensing can provide many benefits for consum9 The finding that hours and the capacity utilization rate ers, workers, and society, it could also reduce are essentially uncorrelated is consistent with Hall and efficiency and distort markets. Occupational Krueger's (2015) finding that hours and revenue earned per hour are essentially uncorrelated for UberX drivers. is licttle public safety or other societal benefitStep by Step Solution
There are 3 Steps involved in it
1 Expert Approved Answer
Step: 1 Unlock

Question Has Been Solved by an Expert!
Get step-by-step solutions from verified subject matter experts
Step: 2 Unlock
Step: 3 Unlock