

Question: A. Determine the mean and standard deviation statistics for the frequency and severity distributions respectively. Show your calculation. B. Calculate the mean and standard deviation
A. Determine the mean and standard deviation statistics for the frequency and severity distributions respectively. Show your calculation. B. Calculate the mean and standard deviation of the aggregate loss distribution from your answers to question A.1 Show your calculation.
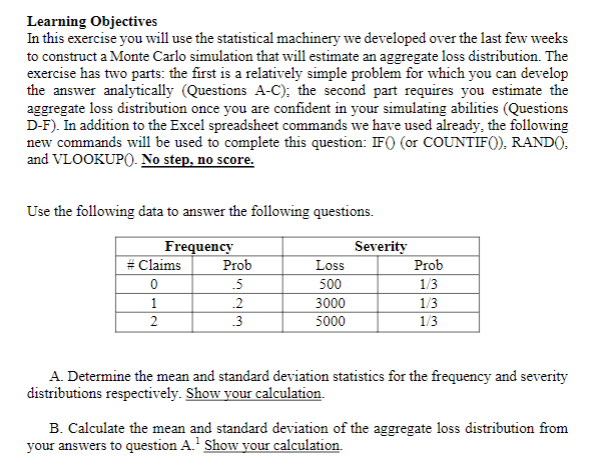
Learning Objectives In this exercise you will use the statistical machinery we developed over the last few weeks to construct a Monte Carlo simulation that will estimate an aggregate loss distribution. The exercise has two parts: the first is a relatively simple problem for which you can develop the answer analytically (Questions A-C), the second part requires you estimate the aggregate loss distribution once you are confident in your simulating abilities (Questions D-F). In addition to the Excel spreadsheet commands we have used already, the following new commands will be used to complete this question: IFO (or COUNTIFO), RANDO. and VLOOKUPO- No step, no score. Use the following data to answer the following questions. Frequency #Claims Prob 0 5 1 .2 2 3 Severity Loss Prob 500 1/3 3000 1/3 5000 1/3 A. Determine the mean and standard deviation statistics for the frequency and severity distributions respectively. Show your calculation. B. Calculate the mean and standard deviation of the aggregate loss distribution from your answers to question A. Show your calculation Learning Objectives In this exercise you will use the statistical machinery we developed over the last few weeks to construct a Monte Carlo simulation that will estimate an aggregate loss distribution. The exercise has two parts: the first is a relatively simple problem for which you can develop the answer analytically (Questions A-C), the second part requires you estimate the aggregate loss distribution once you are confident in your simulating abilities (Questions D-F). In addition to the Excel spreadsheet commands we have used already, the following new commands will be used to complete this question: IFO (or COUNTIFO), RANDO. and VLOOKUPO- No step, no score. Use the following data to answer the following questions. Frequency #Claims Prob 0 5 1 .2 2 3 Severity Loss Prob 500 1/3 3000 1/3 5000 1/3 A. Determine the mean and standard deviation statistics for the frequency and severity distributions respectively. Show your calculation. B. Calculate the mean and standard deviation of the aggregate loss distribution from your answers to question A. Show your calculation
Step by Step Solution
There are 3 Steps involved in it

Get step-by-step solutions from verified subject matter experts