

Question: Data Use the data in these tables to complete the tasks below. Frequency Severity Probability m Probability Tasks 1. Calculate the mean and standard deviation
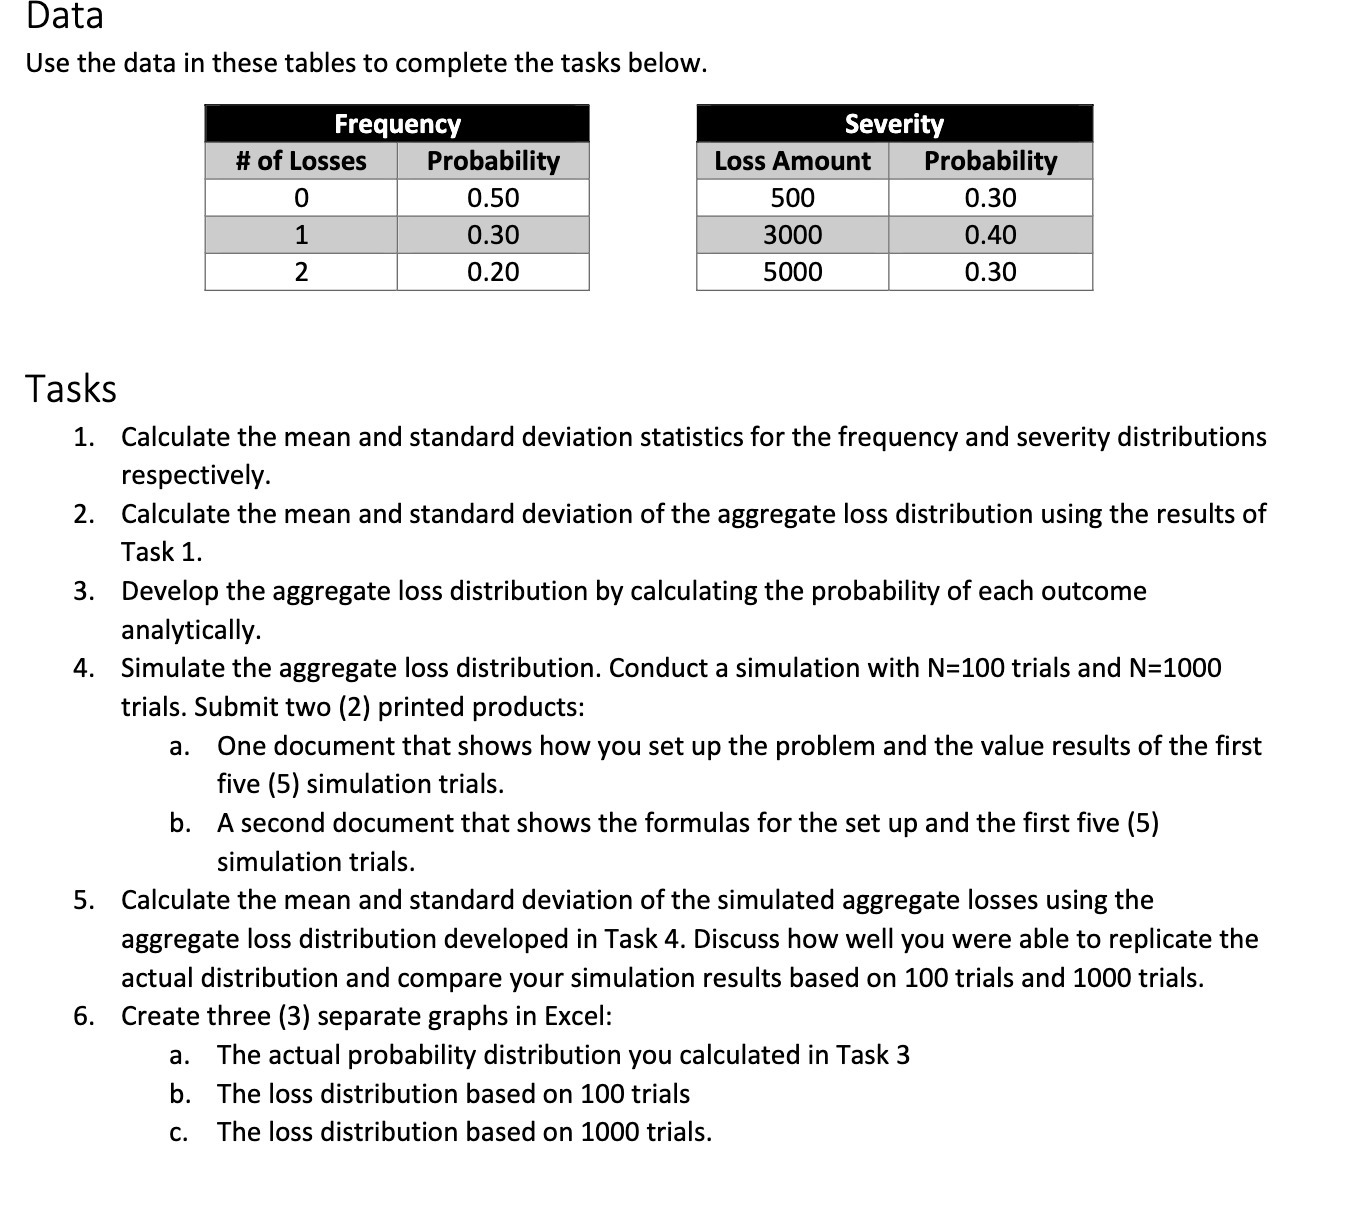

Data Use the data in these tables to complete the tasks below. Frequency Severity Probability m Probability Tasks 1. Calculate the mean and standard deviation statistics for the frequency and severity distributions respectively. 2. Calculate the mean and standard deviation of the aggregate loss distribution using the results of Task 1. 3. Develop the aggregate loss distribution by calculating the probability of each outcome analytically. 4. Simulate the aggregate loss distribution. Conduct a simulation with N=100 trials and N=1000 trials. Submit two (2) printed products: a. One document that shows how you set up the problem and the value results of the first five (5) simulation trials. b. A second document that shows the formulas for the set up and the first five (5) simulation trials. 5. Calculate the mean and standard deviation of the simulated aggregate losses using the aggregate loss distribution developed in Task 4. Discuss how well you were able to replicate the actual distribution and compare your simulation results based on 100 trials and 1000 trials. 6. Create three (3) separate graphs in Excel: a. The actual probability distribution you calculated in Task 3 b. The loss distribution based on 100 trials c. The loss distribution based on 1000 trials
Step by Step Solution
There are 3 Steps involved in it

Get step-by-step solutions from verified subject matter experts