

Question: (a) Determine the values for the x-axis based on your surface area data. (b) Plot the average settling time for each shape on the grid.
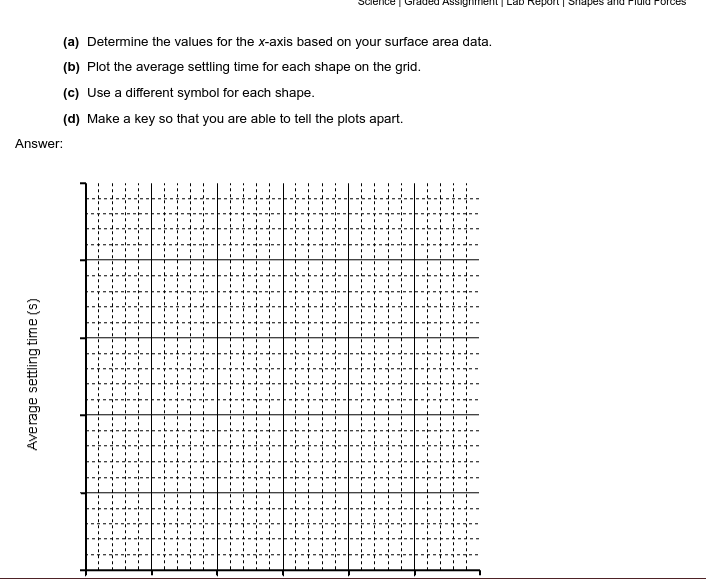
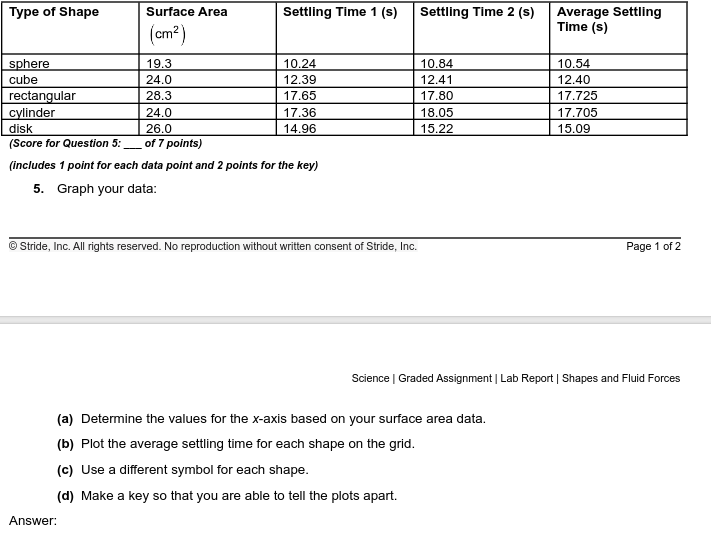
(a) Determine the values for the x-axis based on your surface area data. (b) Plot the average settling time for each shape on the grid. (c) Use a different symbol for each shape. (d) Make a key so that you are able to tell the plots apart. Answer: Average settling time (S)Type of Shape Surface Area Settling Time 1 (s) Settling Time 2 (s) Average Settling ( cm? ) Time (s) sphere 19.3 10.24 10.84 10.54 cube 24.0 12.39 12.41 12.40 rectangular 28.3 17.65 17.80 17.725 cylinder 24.0 17.36 18.05 17.705 disk 26.0 14.96 15.22 15.09 (Score for Question 5: _ of 7 points) (includes 1 point for each data point and 2 points for the key) 5. Graph your data: @ Stride, Inc. All rights reserved. No reproduction without written consent of Stride, Inc. Page 1 of 2 Science | Graded Assignment | Lab Report | Shapes and Fluid Forces (a) Determine the values for the x-axis based on your surface area data. (b) Plot the average settling time for each shape on the grid. (c) Use a different symbol for each shape. (d) Make a key so that you are able to tell the plots apart
Step by Step Solution
There are 3 Steps involved in it

Get step-by-step solutions from verified subject matter experts