

Question: A discussion board post in this course presented a test process data set (Test Results) at the Carbone Cancer. The table shows monthly test requests
 A discussion board post in this course presented a test process data set (Test Results) at the Carbone Cancer. The table shows monthly test requests along with the average days to complete a test. Considering process measures discussion, on average how many test requests are being processed. Note that a typical month is 20 working days. Month Test Requests Days to Complete 1 58 10.3 2 62 8.7 3 63 13.7 4 68 11.7 5 65 14 6 58 8.8 7 43 10.4 8 31 8.6 9 38 8.1 10 53 6.2 11 43 10.3 12 33 9.7
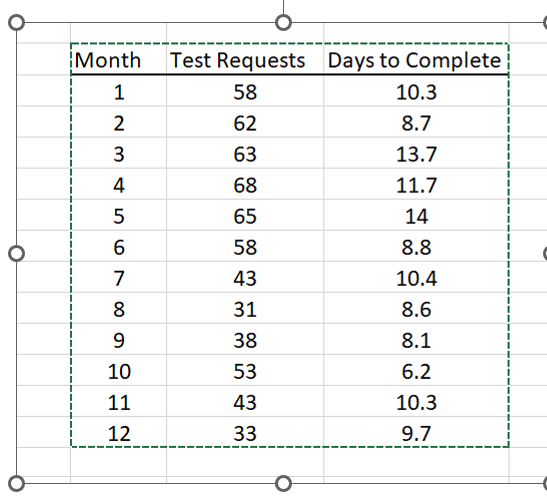
\begin{tabular}{|c|c|c|} \hline Month & Test Requests & Days to Complete \\ \hline 1 & 58 & 10.3 \\ \hline 2 & 62 & 8.7 \\ \hline 3 & 63 & 13.7 \\ \hline 4 & 68 & 11.7 \\ \hline 5 & 65 & 14 \\ \hline 6 & 58 & 8.8 \\ \hline 7 & 43 & 10.4 \\ \hline 8 & 31 & 8.6 \\ \hline 9 & 38 & 8.1 \\ \hline 10 & 53 & 6.2 \\ \hline 11 & 43 & 10.3 \\ \hline 12 & 33 & 9.7 \\ \hline \end{tabular}
Step by Step Solution
There are 3 Steps involved in it

Get step-by-step solutions from verified subject matter experts