

Question: A distribution network supplies demand Q 1 , Q 2 , and Q 3 at three locations ( in L / s ) . The
A distribution network supplies demand Q Q and Q at three locations in Ls The
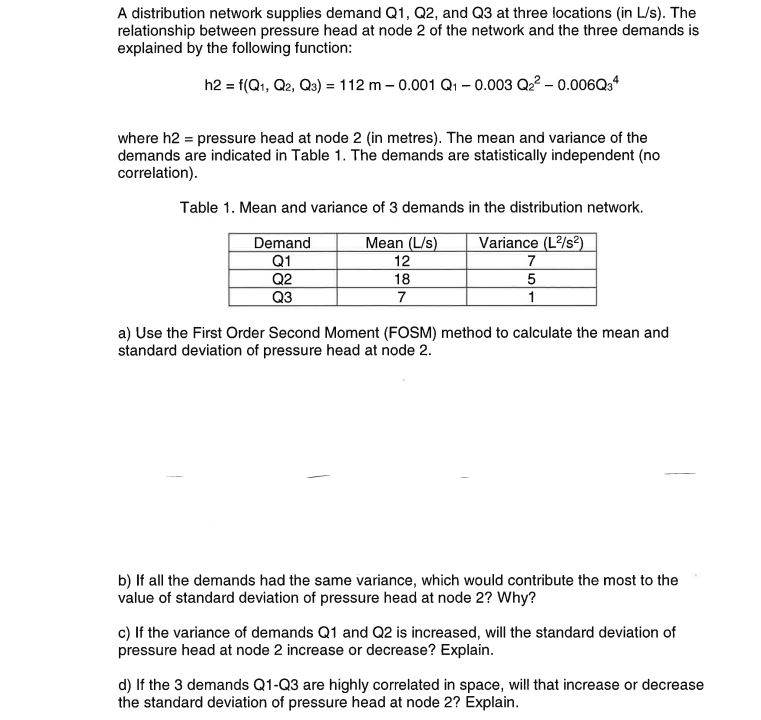
relationship between pressure head at node of the network and the three demands is
explained by the following function:
where h pressure head at node in metres The mean and variance of the
demands are indicated in Table The demands are statistically independent no
correlation
Table Mean and variance of demands in the distribution network.
a Use the First Order Second Moment FOSM method to calculate the mean and
standard deviation of pressure head at node
b If all the demands had the same variance, which would contribute the most to the
value of standard deviation of pressure head at node Why?
c If the variance of demands Q and Q is increased, will the standard deviation of
pressure head at node increase or decrease? Explain.
d If the demands QQ are highly correlated in space, will that increase or decrease
the standard deviation of pressure head at node Explain.
Step by Step Solution
There are 3 Steps involved in it
1 Expert Approved Answer
Step: 1 Unlock

Question Has Been Solved by an Expert!
Get step-by-step solutions from verified subject matter experts
Step: 2 Unlock
Step: 3 Unlock