

Question: a) Does a linear trend appear to fit these data well? Explain why or why not. Reference any tables/figures that you need to make your
a) Does a linear trend appear to fit these data well? Explain why or why not. Reference any tables/figures that you need to make your point.
b) Build a linear trend model or nonlinear trend regression model (depending on your answer in part a). Do not add a seasonality factor to this model. To validate your model, use the last 12 months as a validation data set.
- Display the regression output as 'P4 (b)'in your Excel file. Attach the plot of the fitted values and the actual values over time in worksheet 'Answer' in your Excel file.
- Fill in the table below with your predictions and errors. What are the RMSE and MAPE of the trend model based on the validation data? Display the results in the worksheet'Answer'.
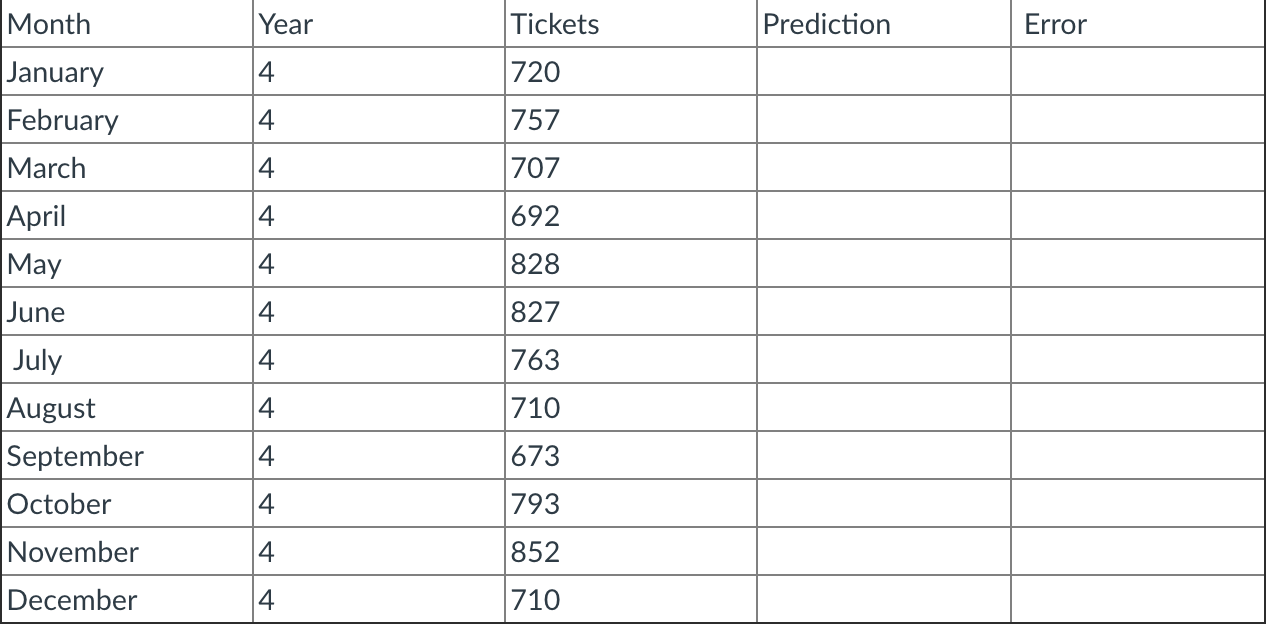
Month Year Tickets Prediction Error January 4 720 February 4 757 March 4 707 April 4 692 May 4 828 June 4 827 July 4 763 August 4 710 September 4 673 October 4 793 November 4 852 December 4 710
Step by Step Solution
There are 3 Steps involved in it
1 Expert Approved Answer
Step: 1 Unlock

Question Has Been Solved by an Expert!
Get step-by-step solutions from verified subject matter experts
Step: 2 Unlock
Step: 3 Unlock