

Question: (a) Download the data from the course website. What are the average excess returns for the ve risky portfolios during 1f1930-12f193? Use Excel to compute
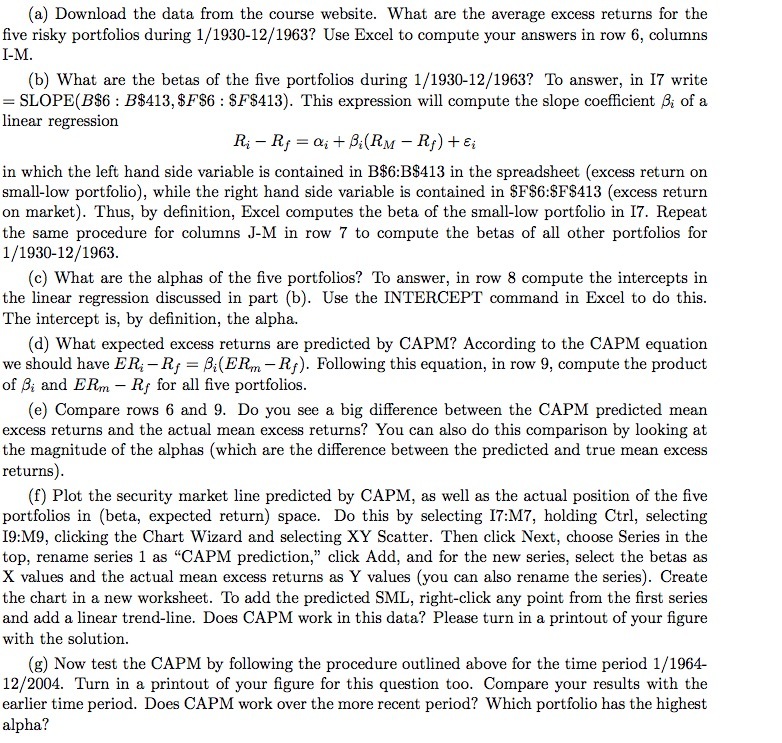
(a) Download the data from the course website. What are the average excess returns for the ve risky portfolios during 1f1930-12f193? Use Excel to compute your answers in row 6, columns [-M. [b] What are the betas of the ve portfolios during 1 f193-12f1963? To answer, in I? write = SLOPE[B$B : B$413, $F$ : $F$413). This expression will compute the slope coefcient ,6} of a linear regression R12 R; = t+13dRM Rf] +51 in which the left hand side variable is contained in B$=B$413 in the spreadsheet [excess return on small-low portfolio], while the right hand side variable is contained in $F$:$F$413 {excl-Is return on market]. Thus, by denition, Ehrcel computes the beta of the small-low portfolio in IT. Repeat the same procedure for columns J-M in row 7 to compute the betas of all other portfolios for 1/1930-12/193. (c) What are the alphas of the ve portfolios? To answer, in row 3 compute the intercepts in the linear regression discussed in part {b}. Use the H'ITERCEFI' command in Excel to do this. The intercept is, by denition, the alpha [d] What expected excess returns are predicted by CAPM? According to the CAPM equation we should have ER,- R; = dERm Rf]. Following this equation, in row 9, compute the product of ,6,- and ER"; R; for all ve portfolios. (e) Compare rows 6 and 9. Do you see a big difference between the CAPM predicted mean excess returns and the actual mean excess returns? You can also do this comparison by looking at the magnitude of the alphas (which are the difference between the predicted and true mean excess returns). (f) Plot the security market line predicted by CAPM, as well as the actual position of the ve portfolios in (beta, expected return} space. Do this by selecting IT:M?, holding Ctr], selecting [9:MQ, clicking the Chart Wizard and selecting KY Scatter. Then click Next, choose Series in the top, rename series 1 as \"CAPM prediction,\" click Add, and for the new series, select the betas as K values and the actual mean excess returns as Y values (you can also rename the series}. Create the chart in a new worksheet. To add the predicted SML, right-click any point from the rst series and add a linear trend-line. Does CAPM work in this data? Please turn in a printout of your gure with the solution. (g) Now test the CAPM by following the procedure outlined above for the time period 1,?1964- 12/2004. Turn in a printout of your gure for this question too. Compare your results with the earlier time period. Does CAPM work over the more recent period? Which portfolio has the highest alpha
Step by Step Solution
There are 3 Steps involved in it

Get step-by-step solutions from verified subject matter experts