

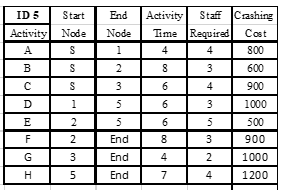
Question: a . Draw PERT Chart with earliest and latest start and finish times / activity . Fill in the slack time in the table for
a Draw PERT Chart with earliest and latest start and finish timesactivity Fill in the slack time in the table for each activity. Show the slack time for each path for all paths and show Critical Path CPM and CPM time.
b What is the expected time for and percent Confidence Interval CI for the project?
c Show the ID Confidence Interval for the project use section page for parts for only one percentage corresponding to your ID id not all percentages
The total project duration time can be estimated from the critical path by the addition of all critical activities times. In order to account for the uncertainties in estimating these times, two probability based methods can be used:
Determine three different estimates for each activity time: realistic most likely optimistic, and pessimistic. These would represent three probability levels based on linear approximations of the normal curve. The realistic estimate is or percent of the total area under the curve, corresponding to pm onesigma activity. Optimistic and pessimistic linear approximations are or percent of the area under the normal curve, corresponding to outside of the pm onesigma activity. All three estimates will account for the total area under the linear approximation of the normal curve as follows:
The expected activity time EAT formula calculates an activity time based on the PMs estimate of the extremes of activity completion variance around the original time estimate. The total project duration time can be calculated from the sum of all expected critical activity times.
Alternatively the PM could estimate the standard deviation sigma of critical activity time distribution, based on their own experience. The PM can then determine the confidence interval CI of project duration by calculating the project variability sigma project from all critical activitiessigma using root mean square RMS methodology. The CI produces a minimum and a maximum project duration estimate based on the desired confidence. The sigma project can be calculated as follows:
Once the sigma project is calculated, then CI may be estimated for a selected confidence percentage. Examples are percent confidence pm sigma project and percent confidence pm sigma project The percent CI for the project estimated duration is equivalent to declaring that a project completion will fall within pm sigma project CI in percent of the time. The end points represent the most optimistic and pessimistic times consequently.
For example, lets assume a project with a critical path of weeks with four critical activities that the PM has estimated to have standard deviations sigma of and At percent confidence, the minimum project duration optimistic time will be weeks and the maximum project duration pessimistic time will be weeks, as follows:
sigma project percent CI pm sigma project pm minimumoptimistic and maximumpessimistic project duration To double check, EAT weeks.
The most common confidence intervals used for project duration estimates are and percent, corresponding to pm sigma project percent CI and pm sigma project percent CI of the project duration estimate.
Step by Step Solution
There are 3 Steps involved in it
1 Expert Approved Answer
Step: 1 Unlock

Question Has Been Solved by an Expert!
Get step-by-step solutions from verified subject matter experts
Step: 2 Unlock
Step: 3 Unlock