

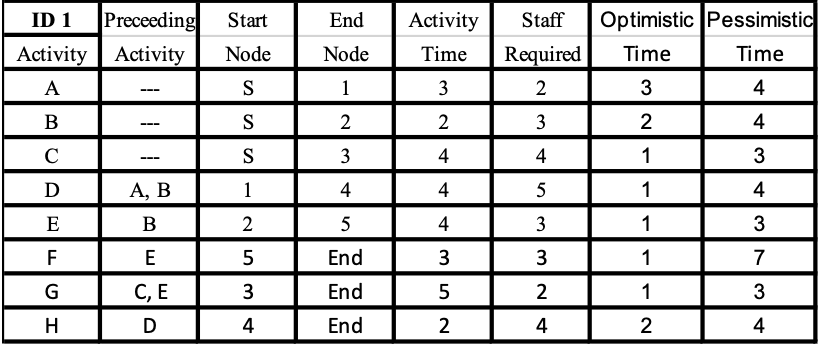
Question: a. Draw PERT Chart with earliest and latest start and finish times/activity. Fill in the slack time in the table for each activity. Show the
a. Draw PERT Chart with earliest and latest start and finish times/activity. Fill in the slack time in the table for each activity. Show the slack time for each path for all paths and show Critical Path (CPM) and CPM time.
b. What is the expected time for 68, 95 and 99 percent Confidence Interval (CI) for the project?
c. Show the 60% Confidence Interval for the project
Step by Step Solution
There are 3 Steps involved in it
1 Expert Approved Answer
Step: 1 Unlock

Question Has Been Solved by an Expert!
Get step-by-step solutions from verified subject matter experts
Step: 2 Unlock
Step: 3 Unlock