

Question: A. Draw the project network diagram B. Complete the Table Below C. Calculate the critical path D. Calculate project changes and standard deviations. to. Calculate
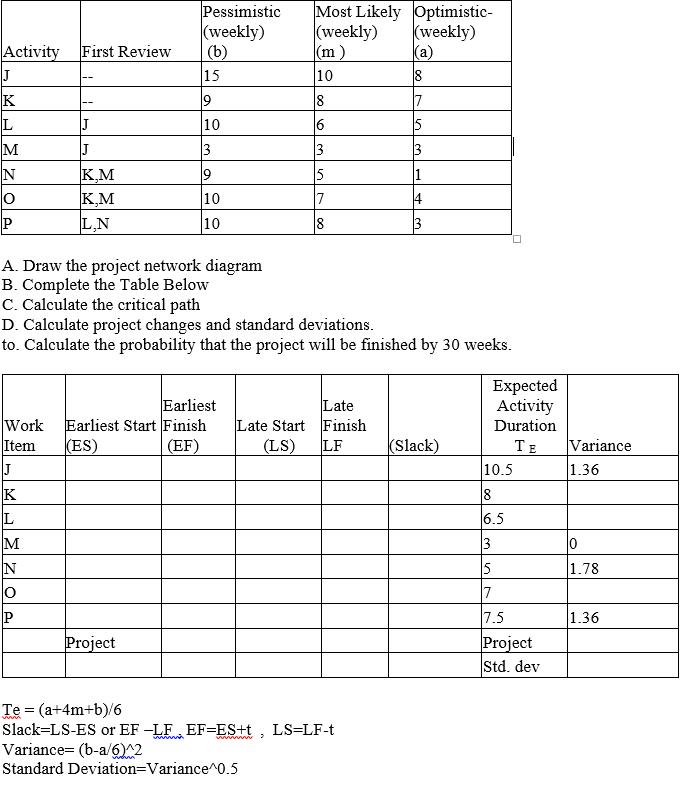
A. Draw the project network diagram B. Complete the Table Below C. Calculate the critical path D. Calculate project changes and standard deviations. to. Calculate the probability that the project will be finished by 30 weeks. Te=(a+4m+b)/6Slack=LSESorEFLF,EF=ES+t,LS=LFtVariance=(ba/6)2StandardDeviation=Variance0.5
Step by Step Solution
There are 3 Steps involved in it
1 Expert Approved Answer
Step: 1 Unlock

Question Has Been Solved by an Expert!
Get step-by-step solutions from verified subject matter experts
Step: 2 Unlock
Step: 3 Unlock