

Question: (a) Explain price compression. Draw a graph to illustrate your answer. (10 marks) (b) Molloy, CFA has a fixed income portfolio with a par
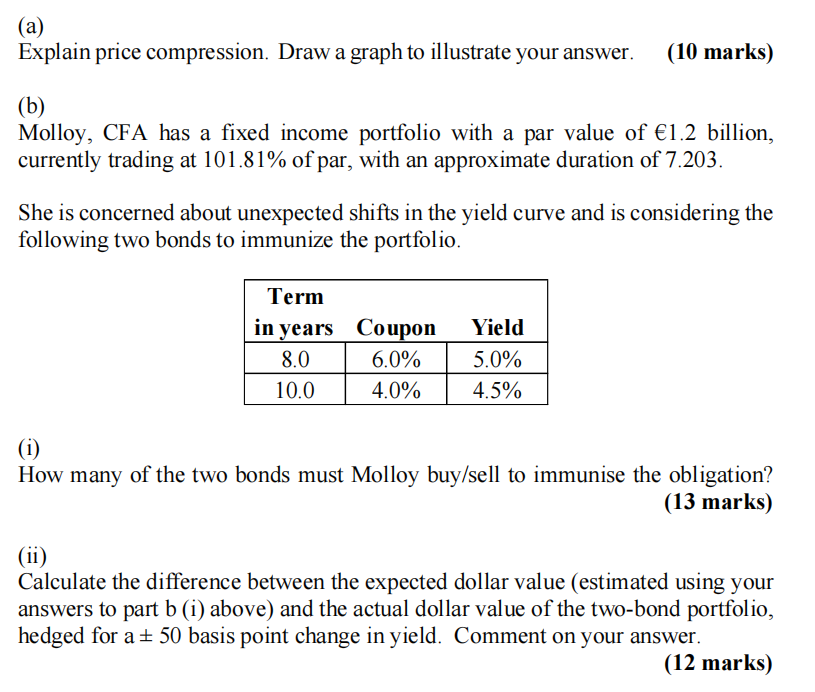
(a) Explain price compression. Draw a graph to illustrate your answer. (10 marks) (b) Molloy, CFA has a fixed income portfolio with a par value of 1.2 billion, currently trading at 101.81% of par, with an approximate duration of 7.203. She is concerned about unexpected shifts in the yield curve and is considering the following two bonds to immunize the portfolio. (i) Term in years Coupon Yield 8.0 10.0 6.0% 5.0% 4.0% 4.5% How many of the two bonds must Molloy buy/sell to immunise the obligation? (ii) (13 marks) Calculate the difference between the expected dollar value (estimated using your answers to part b (i) above) and the actual dollar value of the two-bond portfolio, hedged for a 50 basis point change in yield. Comment on your answer. (12 marks)
Step by Step Solution
There are 3 Steps involved in it

Get step-by-step solutions from verified subject matter experts