

Question: A). Explore the bivariate table (The Senate should be abolished * Highest Level of Education 3 Crosstabulation). Describe what you see in the table. Does
A). Explore the bivariate table (The Senate should be abolished * Highest Level of Education 3 Crosstabulation). Describe what you see in the table. Does it look like there is a relationship between the two variables? If so, describe the pattern of that relationship. [15 marks]
B). Now - explore the calculated statistics in the output block Symmetric Measures. Is there a relationship between the two variables? How strong is this relationship and in what direction? Is the relationship significant? [10 marks]
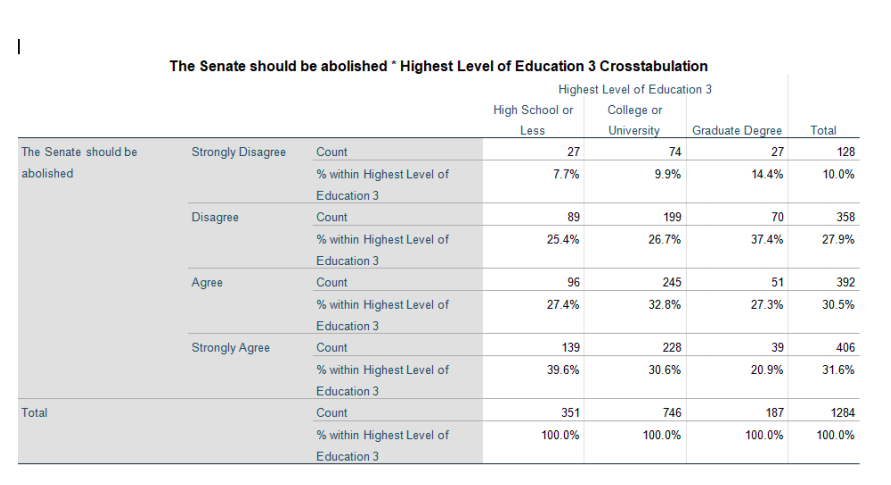
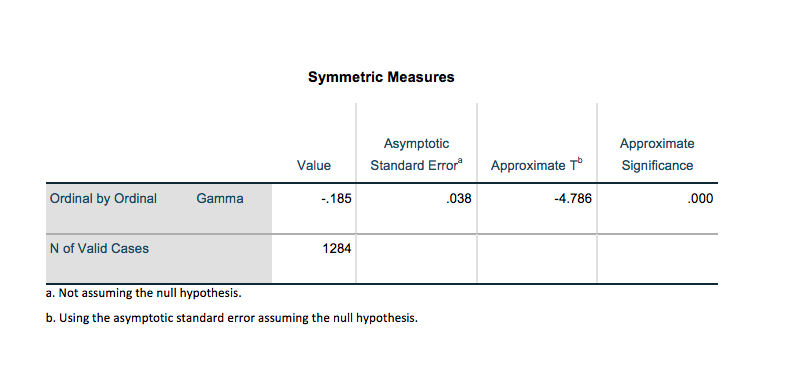
The Senate should be abolished * Highest Level of Education 3 Crosstabulation Highest Level of Education 3 High School or College or Less University Graduate Degree Total The Senate should be Strongly Disagree Count 27 74 27 128 abolished % within Highest Level of 7.7% 9.9% 14.4% 10.0% Education 3 Disagree Count 89 199 70 358 % within Highest Level of 25.4% 26.7% 37.4% 27.9% Education 3 Agree Count 96 245 51 392 % within Highest Level of 27.4% 32.8% 27.3% 30.5% Education 3 Strongly Agree Count 139 228 39 406 % within Highest Level of 39.6% 30.6% 20.9% 31.6% Education 3 Total Count 351 746 187 1284 % within Highest Level of 100.0% 100.0% 100.0% 100.0% Education 3Symmetric Measures Asymptotic Approximate Value Standard Error Approximate To Significance Ordinal by Ordinal Gamma -.185 038 -4.786 000 N of Valid Cases 1284 a. Not assuming the null hypothesis. b. Using the asymptotic standard error assuming the null hypothesis
Step by Step Solution
There are 3 Steps involved in it

Get step-by-step solutions from verified subject matter experts