

Question: a) for the given sample size, the control limits for 3-sigma x chart are: Upper control limit= Lower control limit= b) the control limits for

a) for the given sample size, the control limits for 3-sigma x chart are: Upper control limit= Lower control limit=
b) the control limits for the 3-sigma r-chart are: upper control limit= lower control limit=
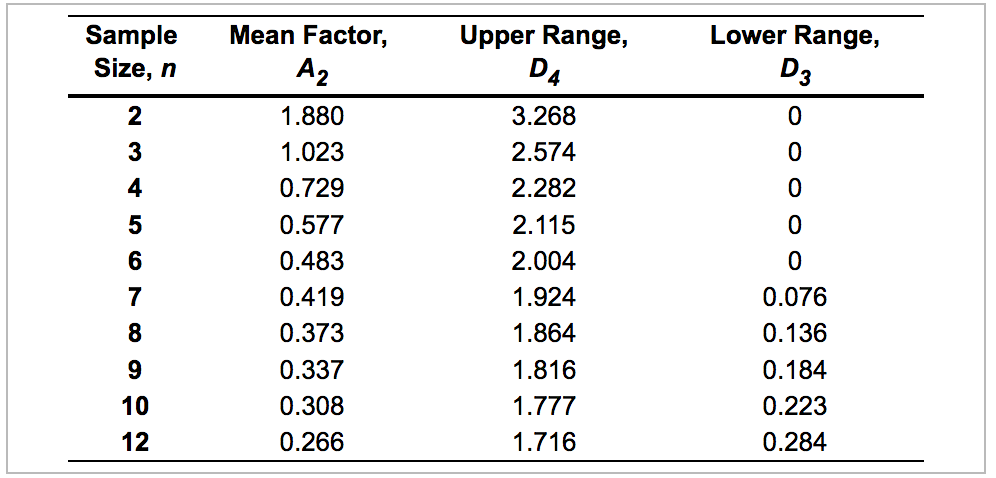
54.75 lb.; Thirty-five samples of size 7 each were taken from a fertilizer-bag-filling machine at Panos Kouvelis Lifelong Lawn Ltd. The results were: Overall mean = Average range R = 1.78 lb. Sample Size, n Lower Range, D3 2 0 3 0 4 0 5 Mean Factor, A2 1.880 1.023 0.729 0.577 0.483 0.419 0.373 0.337 0.308 0.266 Upper Range, D4 3.268 2.574 2.282 2.115 2.004 1.924 1.864 1.816 1.777 1.716 6 7 8 0 0 0.076 0.136 0.184 0.223 0.284 9 10 12Step by Step Solution
There are 3 Steps involved in it
1 Expert Approved Answer
Step: 1 Unlock

Question Has Been Solved by an Expert!
Get step-by-step solutions from verified subject matter experts
Step: 2 Unlock
Step: 3 Unlock