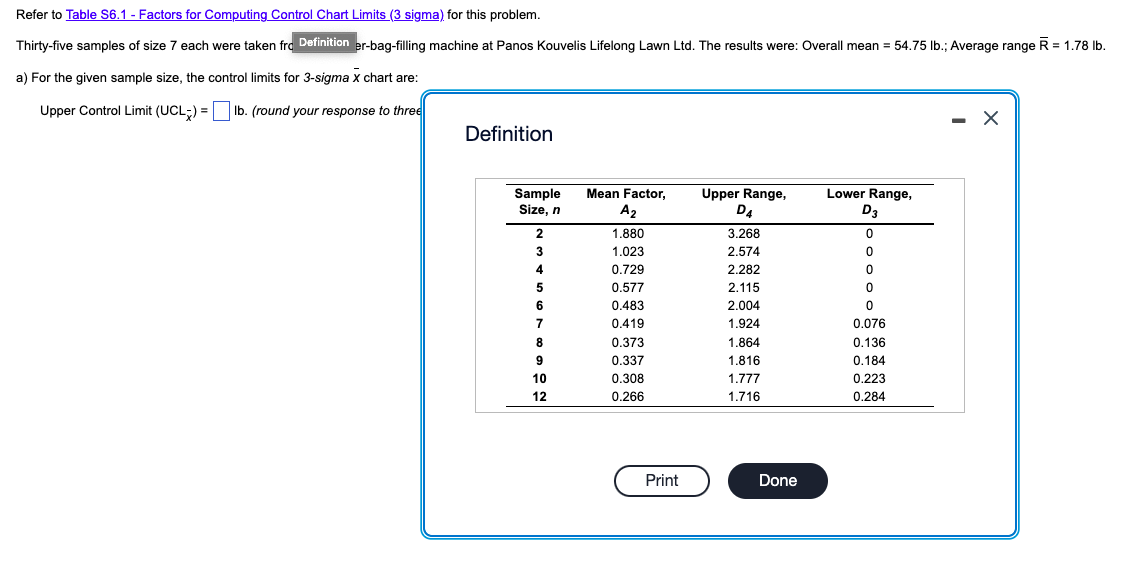
Question: Please show what formula to use step by step. Refer to Table S6.1 - Factors for Computing Control Chart Limits (3 sigma) for this problem.

Please show what formula to use step by step.Please show what formula to use step by step.

Refer to Table S6.1 - Factors for Computing Control Chart Limits (3 sigma) for this problem. R Thirty-five samples of size 7 each were taken fra Definition er-bag-filling machine at Panos Kouvelis Lifelong Lawn Ltd. The results were: Overall mean = 54.75 lb.; Average range R = 1.78 lb. a) For the given sample size, the control limits for 3-sigma x chart are: Upper Control Limit (UCL-) = 1b. (round your response to three - X Definition Sample Size, n Lower Range, D3 2 2 3 4 0 0 0 5 6 7 7 8 9 10 12 Mean Factor, A2 1.880 1.023 0.729 0.577 0.483 0.419 0.373 0.337 0.308 0.266 Upper Range, D4 3.268 2.574 2.282 2.115 2.004 1.924 1.864 1.816 1.777 1.716 0 0 0.076 0.136 0.184 0.223 0.284 Print Done

Step by Step Solution

There are 3 Steps involved in it

1 Expert Approved Answer
Step: 1 Unlock blur-text-image
Question Has Been Solved by an Expert!

Get step-by-step solutions from verified subject matter experts

Step: 2 Unlock
Step: 3 Unlock

Students Have Also Explored These Related General Management Questions!